ni.com is currently undergoing scheduled maintenance.
Some services may be unavailable at this time. Please contact us for help or try again later.
- Subscribe to RSS Feed
- Mark Topic as New
- Mark Topic as Read
- Float this Topic for Current User
- Bookmark
- Subscribe
- Mute
- Printer Friendly Page
Controlling Sampling Rate & Write to File
03-31-2020 01:31 PM - edited 03-31-2020 01:35 PM
- Mark as New
- Bookmark
- Subscribe
- Mute
- Subscribe to RSS Feed
- Permalink
- Report to a Moderator
All,
Apologies if this is a dumb question. Relatively new to LabVIEW, I have a Mechanical Engineer background but need help in creating a data acquisition setup.
I have two Futek strain gauge torque sensors that can read data from the sensor using the attached VI named 'FUTEK LabVIEW 13 Example 2.3.2003.3' that was created by the engineers that supplied my torque sensor. I need to read and write data from each of these sensors simultaneously and then write that data to a file. So far, I've been able to duplicate the 'FUTEK LabVIEW 13 Example 2.3.2003.3' into a VI that successfully reads data from both sensors and writes them to a file. In short, the supplied VI from Futek takes calibration values from the sensor and then applies those to the current reading from the sensor.
The issue is that the VI I created doesn't sample at a high enough frequency for my application. I'm looking for a variable sample rate in the front panel that will be able to go anywhere from 5 to 50Hz. Without any control, the sampling rate seems to be floating between 1 and 2 Hz. This clearly is a computational power issue in my eyes, but I don't have the capacity to understand where to improve the efficiency of this VI and also add in the sampling rate control.
My request is for any of you to indicate where the VI can improve on efficiency and also guide me as to how to add in a control for sampling rate.
Thanks!
03-31-2020
02:48 PM
- last edited on
05-09-2025
09:38 PM
by
![]() Content Cleaner
Content Cleaner
- Mark as New
- Bookmark
- Subscribe
- Mute
- Subscribe to RSS Feed
- Permalink
- Report to a Moderator
My first thought would be to redo how you are logging your data. The Write To Measurement File is constantly opening and closing your file, which makes things SLOW. I also would not write to an Excel file because that it a lot of overhead you really don't want to deal with. Instead, create the file before your loop, use Write Text File function inside of the loop, and close the file after the loop. I would use Array To Spreadsheet String to format your data into a string that is written using the Write Text File. By default it uses a tab between your values. If you save the file as a txt file, Excel will still open it up with no issues.
To take it a step further, I would use a Producer/Consumer setup so that you are logging in a parallel loop to the data capture.
There are only two ways to tell somebody thanks: Kudos and Marked Solutions
Unofficial Forum Rules and Guidelines
"Not that we are sufficient in ourselves to claim anything as coming from us, but our sufficiency is from God" - 2 Corinthians 3:5
03-31-2020 04:53 PM
- Mark as New
- Bookmark
- Subscribe
- Mute
- Subscribe to RSS Feed
- Permalink
- Report to a Moderator
This is a huge help, thank you. I've created the steps outlined in a separate VI to make sure I have it understood for outputting a number in a while loop. I can get that to function as you explained.
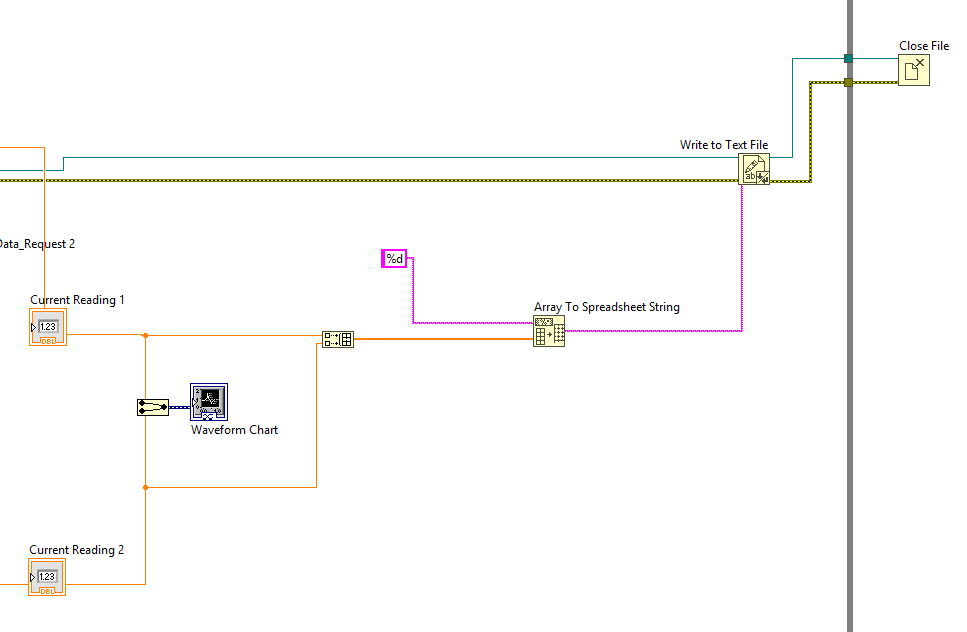
My issue arises when I try and combine my current readings into an array to spreadsheet. I'm outputting zero's in my output .txt file instead of the values that are being read and displayed on my waveform chart. Below is a screenshot of my messy wire diagram. What is the issue here?
Again, thank you for your help, it is much appreciated.

