ni.com is currently undergoing scheduled maintenance.
Some services may be unavailable at this time. Please contact us for help or try again later.
- Subscribe to RSS Feed
- Mark Topic as New
- Mark Topic as Read
- Float this Topic for Current User
- Bookmark
- Subscribe
- Mute
- Printer Friendly Page
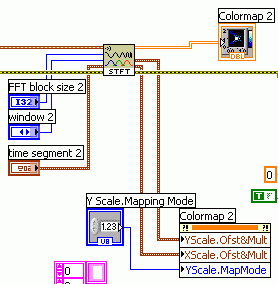
Colormap Y-scale map mode
12-01-2006 09:12 AM - edited 12-01-2006 09:12 AM
- Mark as New
- Bookmark
- Subscribe
- Mute
- Subscribe to RSS Feed
- Permalink
- Report to a Moderator

Property of Scale.

Message Edited by Midlothian on 12-01-2006 09:15 AM
Message Edited by Midlothian on 12-01-2006 09:24 AM
12-06-2006 04:53 AM
- Mark as New
- Bookmark
- Subscribe
- Mute
- Subscribe to RSS Feed
- Permalink
- Report to a Moderator
Please can you post the section of code you show in the screen shot as a Vi, as I can't find the SubVI you are using.
I can then look into the issue further.
Have you tried replacing the Colormap with an Intensity Graph as this seems to go into logarithmic mode correctly on the Z-axis.
Regards
JamesC
NIUK and Ireland
12-07-2006 04:14 AM - edited 12-07-2006 04:14 AM
- Mark as New
- Bookmark
- Subscribe
- Mute
- Subscribe to RSS Feed
- Permalink
- Report to a Moderator
Hi James,
Here is a SV example with the spectogram like I was using. Could you explain how to get Z in log mode please?
The" Colormap" is an intensity graph and replacing it with a new intensity graph still does not enably Mapping, Logarithmic to be selected - (it is present, but not in black type).
Message Edited by Midlothian on 12-07-2006 04:23 AM
12-07-2006 04:42 AM - edited 12-07-2006 04:42 AM
- Mark as New
- Bookmark
- Subscribe
- Mute
- Subscribe to RSS Feed
- Permalink
- Report to a Moderator
to get Z-scale in log mode: right-click on z-scale (colorbar), select mapping->logarithmic. Or use the appropriate property node.
For intensity graphs it seems log maopping of x- and y-axis is disabled, the context menu entry is gray instead of black. So writing to the property nodes will do nothing...
P.S.: Please try to keep similar questions in one forum thread.
Message Edited by GerdW on 12-07-2006 11:43 AM
12-07-2006 04:27 PM
- Mark as New
- Bookmark
- Subscribe
- Mute
- Subscribe to RSS Feed
- Permalink
- Report to a Moderator
Gerd
The option mapping for is disabled as I pointed out.
The thread did not show on a search so I created a new one. Then searching on other keywords showed the other post still unanswered.
Since this is a support forum and since I pay for this support it seems reasonable to post as I have done.
12-18-2006 03:31 AM - edited 12-18-2006 03:31 AM
- Mark as New
- Bookmark
- Subscribe
- Mute
- Subscribe to RSS Feed
- Permalink
- Report to a Moderator
There seems to be some confusion, earlier you were talking about setting the Y-Scale to be Logarithmic (Frequency). Then in a later post you wanted the colour scale to be Logarithmic (Z-Scale).
We can set the Z-scale to be Linear or Logarithmic, but the X and Y Scales can only be Linear.
Please see the attached screen shot on how to make the colour scale to be Logarithmic.
Regards
JamesC
NIUK and Ireland
Message Edited by JamesC on 12-18-2006 09:32 AM
12-18-2006 06:00 AM
- Mark as New
- Bookmark
- Subscribe
- Mute
- Subscribe to RSS Feed
- Permalink
- Report to a Moderator
12-19-2006 08:51 AM
- Mark as New
- Bookmark
- Subscribe
- Mute
- Subscribe to RSS Feed
- Permalink
- Report to a Moderator
The best way to get features added to our products is to use the Product Suggestion Center. This is also how I would put through the sugegstion, but they hold more weight when a customer asked for a feature directly.
If you can put forward a good reason for the feature (which I feel you can with your Sound and Vibration knowledge), you should hopefully get a much more favourable response than myself.
Regards
JamesC
NIUK and Ireland
12-19-2006 09:34 AM
- Mark as New
- Bookmark
- Subscribe
- Mute
- Subscribe to RSS Feed
- Permalink
- Report to a Moderator
Hi JamesC
Thank you for your advice. I have added the suggestion as shown below.
Spectogram Support for Logarithm Frequency Scale
The Intensity Chart or Color-map currently does not support the
logarithm map mode to enable the spectogram to plot in the normal
standard for the Noise & Vibration analyst.
This results in the requirement to take recordings and then use third
party software to produce compliant reports. The inclusion of a
logarithm scale would enable realtime use of the LabVIEW spectogram.
.
