- Subscribe to RSS Feed
- Mark Topic as New
- Mark Topic as Read
- Float this Topic for Current User
- Bookmark
- Subscribe
- Mute
- Printer Friendly Page
Annotation Label Offset Explanation
11-29-2007 05:19 PM
- Mark as New
- Bookmark
- Subscribe
- Mute
- Subscribe to RSS Feed
- Permalink
- Report to a Moderator
This could lead me into a rant about the partially completed feature that is annotations, but I'm too tired to go into it.
Thanks,
Chris
12-03-2007 10:45 AM
- Mark as New
- Bookmark
- Subscribe
- Mute
- Subscribe to RSS Feed
- Permalink
- Report to a Moderator
12-04-2007 09:40 AM
- Mark as New
- Bookmark
- Subscribe
- Mute
- Subscribe to RSS Feed
- Permalink
- Report to a Moderator
The problems seem to appear when I use an annotation that is snapped to a plot, particularly if one of the axes has some scaling associated with it. I'm not sure what the behavior is when that is the case. I am still experimenting with this, but in my application, when I create an element in the Annotation List that is snapped to my plot, the position and label offset parameters seem to get set arbitrarily after I write it into the property; i.e., I can write the appropriate index, the actual position of the point (after taking into account scale multipliers and offsets), and a label offset of 0,0. I would expect this to create an annotation on a plot at the index I specify, with the label sitting right on top of the point. What actually happens is the annotation point seems to be locked to the correct point on the plot, but the position gets changed to something (I have no idea what), and the offset is also changed randomly. It's not really random, because I always seem to end up with the annotation label somewhere off the display, and almost straight up from the point.
I will try to make a stipped down version of my program and post it so you can see what I am talking about. Who knows, I may find the problem in the process..
Thanks,
Chris
12-04-2007 09:47 AM
- Mark as New
- Bookmark
- Subscribe
- Mute
- Subscribe to RSS Feed
- Permalink
- Report to a Moderator
12-04-2007 10:16 AM
- Mark as New
- Bookmark
- Subscribe
- Mute
- Subscribe to RSS Feed
- Permalink
- Report to a Moderator
What you'll find is that if you create annotations on peaks, the labels will be off the graph display. If you create an annotation at a trough, the label will be visible. It seems to me that somehow the y-axis scale is not properly being accounted for, and since it ignores what I tell it, it's hard to account for.
Chris
12-06-2007 10:27 AM
- Mark as New
- Bookmark
- Subscribe
- Mute
- Subscribe to RSS Feed
- Permalink
- Report to a Moderator
Hi Chris,
I ran your VI and I was able to successfully create annotations where the label was displayed on peaks. Is there something that I missed? I ran this in LabVIEW 8.5. I attached a screenshot of the VI I worked on. Let me know, thanks!
12-06-2007 01:20 PM - edited 12-06-2007 01:21 PM
- Mark as New
- Bookmark
- Subscribe
- Mute
- Subscribe to RSS Feed
- Permalink
- Report to a Moderator
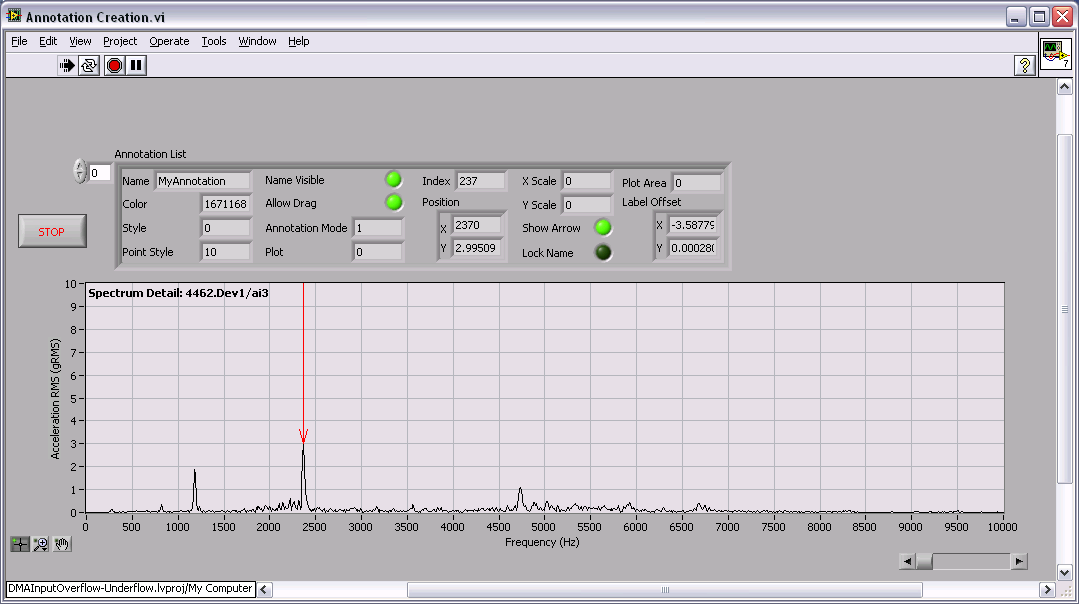
Also, I'm running mine in XP. Here's what it looks like on my machine.
Thanks for your help,
Chris
Message Edited by C. Minnella on 12-06-2007 02:21 PM
12-10-2007 09:31 AM
- Mark as New
- Bookmark
- Subscribe
- Mute
- Subscribe to RSS Feed
- Permalink
- Report to a Moderator
Hi Chris,
The offset X and Y values represent the coordinates of the front panel; they are unrelated to the x and y axis scales. The origin is where the cursor is pointing to. You can change the length and direction of the cursor by left-clicking the annotation when the VI is running. I would suggest moving this around to see the offset values displayed at different angles and different lengths. This will give you a feel as to how the coordinates are displayed. If you move the annotation (cursor) to the left of the origin, or below it, the X or Y offset values will be displayed as negative values.
I was encountering the same issue as you had described, where creating a cursor on a peak forces the cursor to be so long that it is not on the graph. It seems like LabVIEW adjusts this length based on the coordinate that the cursor is pointing to. I would recommend creating the cursors on the lower points of the graph, and then moving them to the desired location. You can then left-click on the annotation to change the length or direction. Thanks Chris!
12-14-2007 04:12 PM - edited 12-14-2007 04:13 PM
- Mark as New
- Bookmark
- Subscribe
- Mute
- Subscribe to RSS Feed
- Permalink
- Report to a Moderator
I think it should be safe to assume that the annotation label offsets are with respect to the location of the annotation point. Sadly, this is not the case, except in the trivial situation where the scale multipliers are 1 and the offsets are 0.
Here is a example vi which demonstrates how to place customized annotations that are snapped to a plot at the location clicked when you right-click to select "Create Annotation". There is a subvi called Create Annotation that does the work, and is suitable for inclusion in other apps. An image of the block diagram is shown below.
For those that are curious, here are the equations that determine the location of the origin that the annotation labels are relative to:
Actual Offset Origin = scaledPosition * scaleMultiplier + scaleOffset
Origin Offset = ((scaledPosition -scaleOffset)/scaleMultiplier) - scaledPosition
where scaledPosition is the x or y position as seen in the annotation list element (this is in scaled axis units)
and Origin Offset is the offset from the actual origin required to place the label at the location of the annotation cursor (i.e., where you'd expect the origin to be)
You can see that for both of these equations, the trivial case (0 offset and 1 multiplier) produces the expected output:
Actual Offset Origin = scaledPosition * (1) + 0 = scaledPosition
Origin Offset = ((scaledPosition - (0))/1) - scaledPosition = 0
The vi's are saved in 8.5. I expect this bug to be fixed at some point, at which time my vi will really munge up the placement of annotation labels. Be WARNED.

Message Edited by C. Minnella on 12-14-2007 05:13 PM
12-18-2007 02:42 PM
- Mark as New
- Bookmark
- Subscribe
- Mute
- Subscribe to RSS Feed
- Permalink
- Report to a Moderator
