- Document History
- Subscribe to RSS Feed
- Mark as New
- Mark as Read
- Bookmark
- Subscribe
- Printer Friendly Page
- Report to a Moderator
- Subscribe to RSS Feed
- Mark as New
- Mark as Read
- Bookmark
- Subscribe
- Printer Friendly Page
- Report to a Moderator
Contact Information
Competition Year: 2016
University: Oxford Brookes University
Team Members (with year of graduation): George Britton (2019)
Faculty Advisers: Extra Curricular Activity
Email Address: 15080895@Brookes.ac.uk
Country: UK
Project Information
Title: Data Driven Launch Control Analysis
Description:
The aim of this program is to quickly make a data-driven choice of launch control settings during the short turn-around time in the acceleration event of a Formula Student competition.
Products:
- National Instruments LabVIEW
- National Instruments VISA
- Arduino Mega
- Arduino CAN shield
- XBEE Modules
The Challenge:

Figure 1. Oxford Brookes Racing at the Acceleration event (Photo by Formula Student Germany)
Formula Student has a quick turnaround during the dynamic event of acceleration. Teams have the option to either exit the track or to complete a second run without delay. In an effort to maintain tire temperatures, the team needs to quickly make decisions about changes in the launch controller during the period of time it takes to get back to the start line following an acceleration run.
What is Formula Student?
Formula Student (FS) is the premier undergraduate educational engineering and motorsports competition, establishsd and sanctioned by the Institution of Mechanical Engineers. Formula Student’s mission is to “excite and encourage young people to take up a career in engineering.” The main goal of the competition is to challenge students with practical, real-life engineering tasks, thereby allowing them to transfer their studies into real life. We take pride at Oxford Brookes Racing in producing a car that is designed and built by students with minimal outsourcing.
We have to design, develop, and manufacture a chassis, suspension, aerodynamics and powertrain. Engineering is not the only focus; we also need to compete in static events, such as Cost and Business. These static events scrutinize the team’s acquisition of sponsorship, allotment of funding, etc.
Who is Oxford Brookes Racing?

Figure 2. Oxford Brookes Racing
Oxford Brookes Racing is currently the one of the most successful UK Formula Student teams, consistently performing in the top tier at competitions all around the world.
Oxford Brookes Racing has continued to grow as a team and improve every year, since inception its 17 years ago. Participation in this competition challenges students to become strong, future engineers. From our years of experience, we have learned that testing is vital, and without quality test data we cannot make effective engineering decisions. During the 2015 season, we identified performance differentiators that allow previous winners to keep winning. Our goal for 2016 is improve the performance of our car to win Formula Student overall and to become the first UK team to win the UK Formula Student competition to win a competition, outright.
The Solution:
Our objectives were to calculate the live slip ratio from the data being received, calculate an approximate acceleration time at 5, 15, and 75 meters from the starting line, and develop a program where an engineer can accurately make a suggestion for the launch control setting needed.

Figure 3. Wireless Communication System on 2016 OBR Car
A wireless telemetry system was developed to allow immediate and remote data processing. This system is comprised of common hobbyist electronics. Figure 4 shows the major components used in the system. CAN data is read from the vehicle bus by an Arduino. The data is then transmitted wirelessly using two Xbee modules. Finally, the data is viewed and processed on a nearby computer.
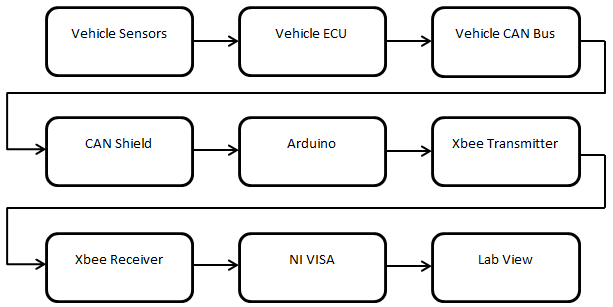
Figure 4. Flow diagram of the system
The system was developed to utilize all current sensors installed on the vehicle, thereby requiring minimal additional hardware. A priority of weight and packaging volume was given to the selection of components for this system. Additionally, this allows transmission of any/all sensor data that is currently broadcast on the CAN bus. For this task, we only require the data from the four wheel speed sensors.
After the computer wirelessly recieves the serial data, it is imported using NI Visa into Lab View. NI VISA allows for a fast integration of the wireless telemetry into the Lab View code. In Lab View the serial data is updated per loop, allowing for constant updates to the live data. The data isseparated and then used for the following calculations.
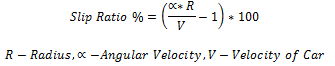
Equation 1. Slip Equation
All tires have mu vs. slip curves, establishing a relationship between the friction coefficient and the tire slip percentage. Ideally, the driven tires would be kept at the slip ratio of maximum friction to achieve the best acceleration performance. A plot of slip ratio vs time was created in the VI to help the engineer visualize the slip behaviour during the acceleration run. The suitability of launch control settings can be determined by the slip of the rear tires.

Figure 5. Data from test acceleration run
There will inevitably be an overshoot of rear wheel speed at the start of the launch as the clutch is rapidly released. This must be maintained; if the ECU attempts to reduce the rear wheel slip at low speeds there is a risk of stalling the engine. It can be seen from Figure 5 that there is a major overshoot of rear wheel speed at the start of the launch, but this is slowly brought down towards the actual vehicle speed as the car accelerates. At 50 kph the slip target is reached and maintained for the brief remainder of the acceleration run.
When the wheels are slipping this area will increase and when the wheels are not slipping this area will decrease. The reason why this area is not quantifiable is because the car is torque limited at the launch, meaning the engine could stall if not allowed the correct amount of revs. If we were not limited by torque the ideal area of the curve would be the slip ratio multiplied by the time. In fact, the system is torque limited at the beginning resulting in the area being unpredictable due to the friction between the surface and the tire being unpredictable. From this information test sessions are important not only to gain data, but also to teach the engineer the optimal area between the two curves.
Inside the LabVIEW code we have integrated a data logging function that will record the area and the time taken to reach that area. This can be post processed to allow the engineer to have data supporting their optimal area. More data can be organized, such as best time, worst time, best area, average area, and an area vs. time curve. This data is critical in maximizing the acceleration performance of the vehicle.

Figure 6. Photo of Test
The implementation of LabVIEW has changed our testing process and our acceleration event procedure. LabVIEW will allow the team to gain data and learn trends about the acceleration of our formula student car in real time. At the event we plan to run the program and the engineer will inform the driver about the best traction control for the current conditions.
The current program is in beta phase and the team has development plans for the future. The future of this program in the next year is to develop a LabVIEW VI that will allow the computer to make traction control setting decisions for the current conditions. The model would be able to predict for the engineer the optimal launch control and record the data involved in making that decision. In the following years the plan for the program is to develop a system integrated into the car to give the exact RPM needed for an optimal launch. Eventually, the team plans to transition to LabVIEW for all telemetry analysis.
LabVIEW is a great asset for our Formula Student team. With the development of our wireless telemetry we can develop many lab view scripts that can help with live analysis for other areas of the car, such as chassis, and across other Formula Student dynamic events.
George Britton
