- Subscribe to RSS Feed
- Mark Topic as New
- Mark Topic as Read
- Float this Topic for Current User
- Bookmark
- Subscribe
- Mute
- Printer Friendly Page
Debugger Error
01-28-2020 06:25 AM - edited 01-28-2020 06:49 AM
- Mark as New
- Bookmark
- Subscribe
- Mute
- Subscribe to RSS Feed
- Permalink
- Report to a Moderator
Hello out there,
I just started to play arond with Open GDS: I've installed Open GOOP 1.2.41 and am using LV19.0f2 x64.
I created an empty project, created a GOOP class with the EndevoGOOP400 class provider, added persistent and debugging Design Pattern. When I now open the debugger, I run into Error 74 occured at Unflattern From String in myClassName.lvclass:myClassName_GetObject_status.vi Possible reason: (Hex 0x4A) Memory or data structure corrupt.
If I open a new VI and use Create -> GetObjectStatus -> Destroy it runs without any errors. Has anybody ran into this before? Any ideas what is going wrong?
Greetings, AlexElb
Edit: By the way, if I use Create and Destroy with a Class with the Persistent Design Pattern the lvclass will be still be locked, since it is still running. I guess this is intended, but how do I cleanup correctly?
Proud developer at Hampel Software Engineering where we turn '404 not found' into '200 OK'. Join us on Discord
01-28-2020 02:11 PM
- Mark as New
- Bookmark
- Subscribe
- Mute
- Subscribe to RSS Feed
- Permalink
- Report to a Moderator
I've not seen that before.
Can you upload your class?
03-21-2021 06:41 AM
- Mark as New
- Bookmark
- Subscribe
- Mute
- Subscribe to RSS Feed
- Permalink
- Report to a Moderator
Hi Michael,
I have come across same issue when trying to use the GDS object debugger.
I have made the class persistent and added the debbugger design pattern.
Running Main.vi and then Tools->GOOP->Debuggers->Open GDS's object debugger.... I get same problem.
Seem like the GetObjectStatus.vi get empty strings from DebuggerInput.
Tested on both LV 2020, 2019 and also 2017.
Attached my counter example developed on LV2017 version 17.0.1f3.
Using OpenGDS, version 1.2.45(108)
BR
Stefan
03-21-2021 06:57 PM
- Mark as New
- Bookmark
- Subscribe
- Mute
- Subscribe to RSS Feed
- Permalink
- Report to a Moderator
I did a quick test and it worked for me (LV2020-64bit), but you need to "activate: the debugging before you create the first object.
03-22-2021 08:35 AM
- Mark as New
- Bookmark
- Subscribe
- Mute
- Subscribe to RSS Feed
- Permalink
- Report to a Moderator
Hi, have activated the debugging as I see it, but perhaps I'm doing it wrong.
1. Open Counter.lvproj
2. Tools->GOOP->Debuggers->Open GDS's Debug Controller...
3. Press button "Turn All On"
4. Start Main. vi
5. Tools->GOOP->Debuggers->Open GDS's Object Debugger...
6. I get the error
I use value "Persistent" as input to Counter_New.vi in Create method. Is that correct setting?
03-22-2021 10:30 PM - edited 03-22-2021 10:35 PM
- Mark as New
- Bookmark
- Subscribe
- Mute
- Subscribe to RSS Feed
- Permalink
- Report to a Moderator
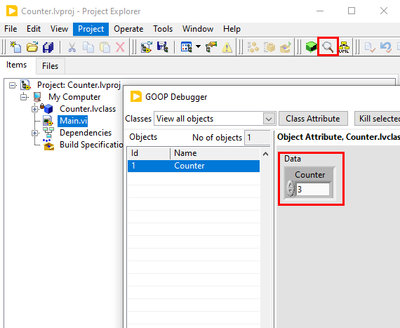
I'm running OpenGDS 2020, and it works there:
What version are you using? (Tools->GOOP->Product Information)
You can always open the debugger VI:
C:\Program Files\National Instruments\LabVIEW 2020\resource\Framework\Providers\Open_GDS\ClassProviders\Provider_EndevoGOOP300\GoopDebugger.vi
And set a break point inside it and save it, then restart LV and reproduce the issue and you;ll be able to debug this VI.
And Yes, using "Persistent" as input to Counter_New.vi is correct,
You could also turn on the debugging programmatically, open the NEW VI and look at the Debug FGV (C:\Program Files\National Instruments\LabVIEW 20XX\vi.lib\addons\_goop4.llb\GOOP4_DebuggingStateMemory.vi)
03-23-2021 06:46 AM - edited 03-23-2021 03:20 PM
- Mark as New
- Bookmark
- Subscribe
- Mute
- Subscribe to RSS Feed
- Permalink
- Report to a Moderator
I have been testing on gds version 1.2.41 and 1.2.45(32-bit) on W10, both generate same error.
So when debugging GoopDebugger.vi I get the error in "GetObjects" Case, when calling "ProbeObjectKernel.vi.
It looks like the call to GetObjectStatus.vi is done with empty Ref, ObjAttribute and ClassAttribute string.
These inputs are not wired in the GoopDebugger.vi. Is this correct?
And this gives the error in GetObjectStatus.vi from the "Unflatten from String function".
/Stefan
03-24-2021 05:36 PM
- Mark as New
- Bookmark
- Subscribe
- Mute
- Subscribe to RSS Feed
- Permalink
- Report to a Moderator
Hi,
The "GetObjects" case is not using the Ref input, it's only reading the Object names.
It's first when you select the object the "ReadAttribute" case is called and there it uses the Ref-input.
So what is happening for you?
Does the GOOP Debugger just quit?
Do you get and objects listed?
Can you get the "ReadAttribute" case to execute?
This Object debugger has not been touched in ages, maybe its' time to clean it up :-).
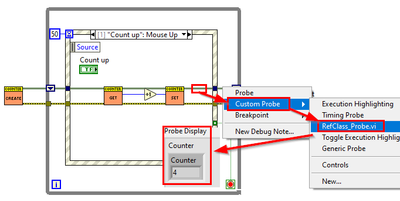
BTW, have you tested the RefClass-Probe?
03-25-2021 02:00 PM
- Mark as New
- Bookmark
- Subscribe
- Mute
- Subscribe to RSS Feed
- Permalink
- Report to a Moderator
Hi,
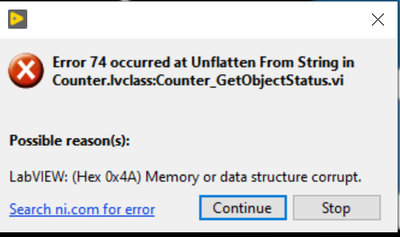
The GOOP Debugger starts but the first that happens is this:
This is because the GOOP Debugger enters the GetObjects case where it calls ProbeObjectKernel.vi without the Ref, ObjAttribute or ClassAttribute inputs wired. So when GetObjectStatus in my Counter class is called with run command in ProbeObjectKernel, the GetObjectStatus have empty values going into the Unflatten From String functions. Which generate the popup error above.
If I press Continue button a couple of times I eventually get a Counter object showing up in GOOP Debugger GUI, but I cannot click it since more errors coming up all the time preventing me from clicking in the debugger GUI. I have to press Stop in Error window and then in Debugg Controller turn debugger off.
No, I have not noticed the RefClass-Probe before, Thanks for that, works good. Will for sure use it more:)
You showed the debugger was working for you in LV2020, so perhaps it is not so much work for you integrating it into the other installers. But you are the better judge of that.
The debugger app can be nice to have to get a overview of all the types of objects currently alive in an application, but for now I guess the RefClass-Probe will work fine.
BR
Stefan


