- Subscribe to RSS Feed
- Mark Topic as New
- Mark Topic as Read
- Float this Topic for Current User
- Bookmark
- Subscribe
- Mute
- Printer Friendly Page
Timestamp value on hover
Solved!02-23-2024 08:14 AM
- Mark as New
- Bookmark
- Subscribe
- Mute
- Subscribe to RSS Feed
- Permalink
- Report to a Moderator
Hi,
I'm building a graph which consists in having amplitude in Y while Timestamp on X
I'm using a cluster which reciever data from 2 arrays(amplitude history and timestamp history)
However, when hovering in the graph, the timestamp value converts to a non timestamp value as you can see in the image below.
I wonder if i can see the timestamp hovering the data point..Therefore, i know the exact time the value was aquired.
Solved! Go to Solution.
02-27-2024 07:18 AM
- Mark as New
- Bookmark
- Subscribe
- Mute
- Subscribe to RSS Feed
- Permalink
- Report to a Moderator
Hi, i found the library PlotHoverTooltip, and i'm trying to use it, however i've come across an error.
Since my code is a little different, and the graph is displayed by a cluster i dont know if it impacts on the error.
The example attached with the library worked fine, but when i use it in my project i get the follow error:
JavaScriptInvoke in Library::Support::PlotHoverFormat.jsli::Plot Hover Format X AbsTime->Library::XAbsTime GraphTooltip.gvi->WebApp::Páginas::Function.gviweb<APPEND>
An exception occurred within the external JavaScript function called by a JavaScript Library Interface node. Verify your JavaScript code is valid.
function: PlotHoverFormat.XAbsTime, Additional information:
Message: Cannot read property 'querySelector' of undefined
Stack: TypeError: Cannot read property 'querySelector' of undefined
at Object.XAbsTime (http://localhost:54907/HtmlVI/Run/VireoDevSystem/Interactive/Library/Support/script.js:9:74)
at e.javaScriptInvoke.jsJavaScriptInvoke (http://localhost:54907/HtmlVI/Run/VireoDevSystem/Interactive/WebApp/ni-webvi-resource-v0/VireoImport...)
at u (http://localhost:54907/HtmlVI/Run/VireoDevSystem/Interactive/WebApp/ni-webvi-resource-v0/VireoImport...)
at wasm-function[1302]:175
at wasm-function[982]:124
at Object.D.e.eggShell.executeSlicesUntilWait.t.eggShell.executeSlicesUntilWait (http://localhost:54907/HtmlVI/Run/VireoDevSystem/Interactive/WebApp/ni-webvi-resource-v0/VireoImport...)
at zo.executeVireoRuntime (http://localhost:54907/HtmlVI/Run/VireoDevSystem/Interactive/WebApp/ni-webvi-resource-v0/IdeRun.min....)
at e.vireo.eggShell.setExecuteSlicesWakeUpCallback (http://localhost:54907/HtmlVI/Run/VireoDevSystem/Interactive/WebApp/ni-webvi-resource-v0/IdeRun.min....)
at http://localhost:54907/HtmlVI/Run/VireoDevSystem/Interactive/WebApp/ni-webvi-resource-v0/VireoImport...
02-27-2024 08:03 AM - edited 02-27-2024 08:23 AM
- Mark as New
- Bookmark
- Subscribe
- Mute
- Subscribe to RSS Feed
- Permalink
- Report to a Moderator
@Labmecepel wrote:
The example attached with the library worked fine, but when i use it in my project i get the follow error:
function: PlotHoverFormat.XAbsTime, Additional information:
Message: Cannot read property 'querySelector' of undefined
Stack: TypeError: Cannot read property 'querySelector' of undefined
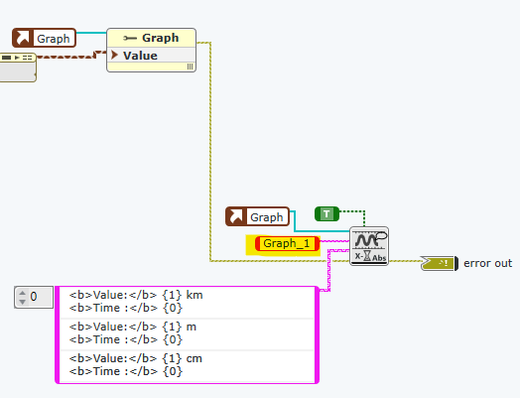
Have you define your Graph Control HTML Class Attribute?
And you need to make sure that your Graph has a plot on it. that for, wire the error cluster.
And you don't need to double write to your graph value.
02-27-2024 10:06 AM
- Mark as New
- Bookmark
- Subscribe
- Mute
- Subscribe to RSS Feed
- Permalink
- Report to a Moderator
It worked, thank you!
03-18-2024 10:47 AM
- Mark as New
- Bookmark
- Subscribe
- Mute
- Subscribe to RSS Feed
- Permalink
- Report to a Moderator
@Labmecepel wrote:
It worked, thank you!
Glad to hear that. You're always welcome🙏
Just to let others whom looking for the example source: Solved: Graph Hover Format for Time Axis. - NI Community


