Overview
To programmatically get the same functionality/behavior as the Chart History Length
Description:
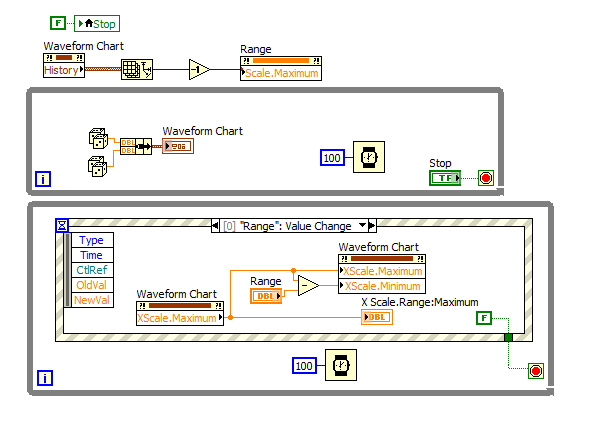
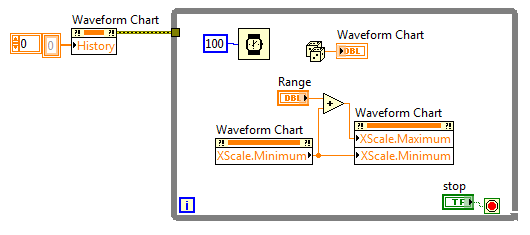
When you set the range of a waveform chart, by right-clicking the waveform chart and selecting Chart History Length - LabVIEW will automatically always show you the end of this range of values. However, if you set the maximum range with a property node, we always see the beginning of this range of values. We can programmatically get the same functionality/behavior as the Chart History Length by checking the current history of the chart, and then setting both the maximum and minimum through a property node. Don't forget that the array is zero-indexed!
Instructions:
To implement this example:
- Run the VI
- Set the Range to Get the Desired Wide of data
To execute this example:
- Install the required software.
- Open the VI and refer the Implement Steps
Requirements
Software
LabVIEW 2012 or compatible
Hardware
-


**This document has been updated to meet the current required format for the NI Code Exchange.**
Regards,
Imtiaz Chowdhury
Project Manager
Green Running / Austin Consultants