Maps for WebVI (Google Maps and Open Street Maps)
- Subscribe to RSS Feed
- Mark as New
- Mark as Read
- Bookmark
- Subscribe
- Printer Friendly Page
- Report to a Moderator
Products and Environment
This section reflects the products and operating system used to create the example.To download NI software, including the products shown below, visit ni.com/downloads.
- G Web Development Software
- LabVIEW NXG
- LabVIEW NXG Web Module
Software
Code and Documents
Attachment
Description
Description-Separate-1This library provides APIs for using Google Maps and OpenStreetMap (via the Leaflet) library. See a demo online.
Features
- Create Maps at specific latitude & longitude
- Programmatically create markers:
- Custom marker icons
- Update marker popup content
- Trigger showing marker popup
- Listen for marker clicks
- Marker grouping for large number of markers
- Programmatically create shapes:
- Polylines
Important Note:
- This library does not include map tile content and makes request to 3rd party servers for map content.
- The Google Map API requires the creation of an API key (see GoogleMap::Map::Initialize Map.gvi).
- The Leaflet Map API requires use of a tile server. The API includes several example tile servers:
- OpenStreetMap Tile Server (see Leaflet::Map::Add Open Street Map Tile Layer.gvi). Please make sure to respect the Open Street Maps Tile Servers Terms of Use.
- Wikimedia Tile Server (see Leaflet::Map::Add Wikimedia Tile Layer.gvi). Please make sure to respect the Wikimedia Maps Tile Servers Terms of Use.
Diagram Palette
Google Maps
Leaflet
Changelog
Release 10: Updates for G Web Development Software 2022 Q3 Patch 2
Release 9: Marker support for icon anchor position and popup anchor position. Breaking Change: Google Map custom icons are now anchored so that the top left corner of the icon is on the marker coordinate. Use the icon anchor position and popup anchor position to position custom icons and popups for custom icons as needed.
Release 8: Support for G Web Development Software 2021
Release 7: Breaking Change: VIs now take a coordinate gtype instead of a separate latitude and longitude. Added support for polyline shapes.
Release 6: Add Zoom to Marker in Marker Group VI for Leaflet library to use when opening a marker in a marker group.
Release 5: Breaking Change: Previously Create Marker took a map reference and automatically added a marker to a specified Map. This change enables support for Marker Groups by allowing markers to be added to either a Map using the Add Markers to Map VI or a Marker Group using the Add Marker Group to Map VI.
Release 4: Adds support for marker click events and adds VI icons to the library VIs.
Release 3: First release available on the community
Description-Separate-2
Milan
Example code from the Example Code Exchange in the NI Community is licensed with the MIT license.
- Mark as Read
- Mark as New
- Bookmark
- Permalink
- Report to a Moderator
This is such a great toolkit for creating interactive geographical MAPs in LabVIEW NXG Web, I highly recommend it. Thanks.
Any chance we could get a grouping function ? I currently have a project with some 250 units worldwide, however, many of them are located rather close to each other, making it hard to see that there are multiple units without zooming.
- Mark as Read
- Mark as New
- Bookmark
- Permalink
- Report to a Moderator
Attached an example of how I use this tool. Unfortunately I cant show the web-site. Each of the dots indicate "one device" either in running = green or in stopped = red mode. More data can be visualized upon clicking on the icons or selecting "user interface/graphs/list view".
- Mark as Read
- Mark as New
- Bookmark
- Permalink
- Report to a Moderator
Hi søren_hallberg_jensen,
I'm glad the Map API has been useful! I made an update as Release 5 that exposes grouping support for both of the libraries. There is a small API change to allow markers to be added to either a Marker Group or directly to the map as described in the Changelog for Release 5.
Milan
- Mark as Read
- Mark as New
- Bookmark
- Permalink
- Report to a Moderator
Hello, how do I create a function to draw polylines on a map?
- Mark as Read
- Mark as New
- Bookmark
- Permalink
- Report to a Moderator
Hello! I want to create polylines on the map. How do I do that? I've tried everything and I've failed, and I need your help.
- Mark as Read
- Mark as New
- Bookmark
- Permalink
- Report to a Moderator
Hello, How do I add the right function to create polyline on the map?
- Mark as Read
- Mark as New
- Bookmark
- Permalink
- Report to a Moderator
Hi zhangzzd,
I updated the Map example to include a demonstration of creating Polyline shapes. Hopefully that is a useful getting started point for seeing how to add new behavior to the library!
Milan
- Mark as Read
- Mark as New
- Bookmark
- Permalink
- Report to a Moderator
@MilanR Thank you very much!I was able to create a polyline on the map, using the example you provided,and I want to achieve the loading of offline maps, how to achieve it?
- Mark as Read
- Mark as New
- Bookmark
- Permalink
- Report to a Moderator
Hi MilanR,
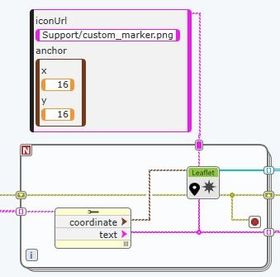
I Just recently Add JSLI function in the Leaflet.js and a cluster to define Anchor position to the Marker Icon so that, it will not always referring to top-left corner of the icon.

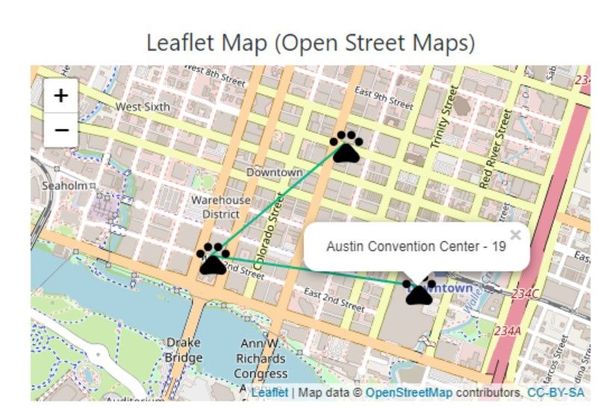
In my example, the anchor is in the center pow (animal foot print)
But I've no idea how to attached my source code here. And what should I name it? Release 9?
- Mark as Read
- Mark as New
- Bookmark
- Permalink
- Report to a Moderator
Thank you very much for the polyline updates on Open Street Maps. I was trying to create different colors depend on a trigger level (for example, red vs blue polylines shown in picture) within one polyline, is there a function available for this purpose?
- Mark as Read
- Mark as New
- Bookmark
- Permalink
- Report to a Moderator
@zhangzzd
I want to achieve the loading of offline maps, how to achieve it?Description-Separate-2
Hi zhangzzd, offline maps are not supported by this example. The example requires public internet access to a map service.
@ThamS
But I've no idea how to attached my source code here. And what should I name it? Release 9?
Description-Separate-2
Hi ThamS, I appreciate the desire to contribute to the example! I had a few concerns with the approach that was taken such as the desire to keep the API as close as possible across the Leaflet and Google Map examples and some simplifications that can avoid needing a new JSLI call by leveraging JSON to send clusters of data.
I appreciate the contributions and in the future instead of editing this example directly I would recommend creating a new example in the Example Code community with the proposed changes and making a comment on here linking to the recommended change. At that point we can discuss adding it to this example or keeping it separate if it is out of the scope of this example.
I removed the example 8.1 attachment and added a 9.0 release that is also published to the demo page link.
@PotatoEE
I was trying to create different colors depend on a trigger level (for example, red vs blue polylines shown in picture) within one polyline, is there a function available for this purpose?Description-Separate-2
Hi PotatoEE, polylines can only be configured with a single stroke color. The recommendation would be to create separate polylines for each segment and color each segment individually.
Milan
- Mark as Read
- Mark as New
- Bookmark
- Permalink
- Report to a Moderator
@MilanR
I appreciate the contributions and in the future instead of editing this example directly I would recommend creating a new example in the Example Code community with the proposed changes and making a comment on here linking to the recommended change. At that point we can discuss adding it to this example or keeping it separate if it is out of the scope of this example.
Description-Separate-2
I See, thank you and well noted. 👍🏻
- Mark as Read
- Mark as New
- Bookmark
- Permalink
- Report to a Moderator
@MilanR Thank you!👍


