LabVIEW Box Plots
- Subscribe to RSS Feed
- Mark as New
- Mark as Read
- Bookmark
- Subscribe
- Printer Friendly Page
- Report to a Moderator
Products and Environment
This section reflects the products and operating system used to create the example.To download NI software, including the products shown below, visit ni.com/downloads.
- LabVIEW
Software
Code and Documents
Attachment
Description
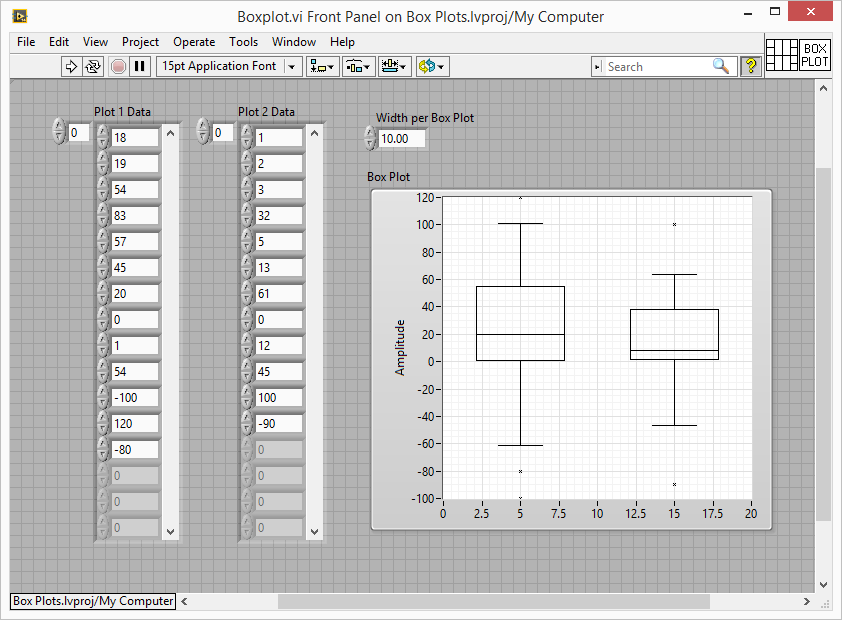
Description-Separate-1The LabVIEW Code attached provides support for creating box plots and having multiple box plots presented on a single graph.
This code started with and improved code from these two examples:
-Creating Boxplots Using LabVIEW
-Boxplots and Stem-and-Leaf Displays
Front Panel:
Block Diagram:

Improvements from the previous verisons:
-Improved quartile calculation: Median and Quartile Calculator (Q1, Q2, Q3) using LabVIEW
-Made multiple box plot graphs work properly
-Added ability to change horizontal scale of plots (width per box)
-Added ability to choose plot color (instead of just black)
-Allows differently sized data arrays for each plot (by using an array of clusters)
Attached versions are in LabVIEW 2014, 2009 and 8.0 (using save for previous)
Description-Separate-2Example code from the Example Code Exchange in the NI Community is licensed with the MIT license.
- Mark as Read
- Mark as New
- Bookmark
- Permalink
- Report to a Moderator
This is amazing. Thank you for creating it.
- Mark as Read
- Mark as New
- Bookmark
- Permalink
- Report to a Moderator
Thank you Craig, very easy to use and nice tool.
CLA since 2010 | CTA since 2012 | CLED since 2016
sjtuyan@gmail.com
- Mark as Read
- Mark as New
- Bookmark
- Permalink
- Report to a Moderator
Still working beautifully in 2022! Thanks for creating this!
