Inactive
- Subscribe to RSS Feed
- Mark as New
- Mark as Read
- Bookmark
- Subscribe
- Printer Friendly Page
- Report to a Moderator
Detailed Error Description in NI I/O Trace
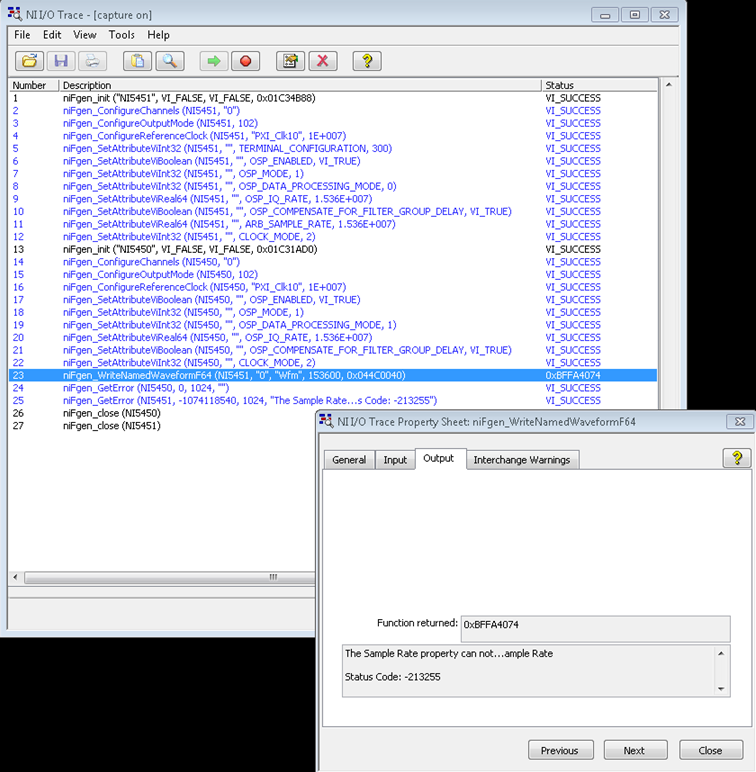
I/O Trace is extremely useful when debugging system-level text-based applications. Error handling for systems involving multiple drivers + software packages (RF toolkits, for example) is very difficult. After recognizing there was an error, we still have to determine which device threw the error and then query the appropriate driver/toolkit with the correct handle to determine what the error was. NI I/O Trace is a great way to quickly determine which device threw an error and at which function call. Unfortunately, the error reporting returned by I/OTrace is pretty limited. For example, consider the I/O Trace shown below of an application synchronizing two waveform generators. A property is not configured correctly for one of the generators. I/O Trace clearly indicates there is an error, however the exact cause of the error is difficult to discern from the message:
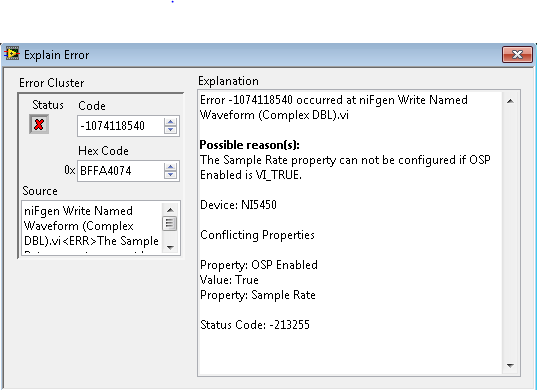
The actual error message is: “The Sample Rate property can not be configured if OSP Enabled is VI_TRUE. “. It would be great if I/O trace could provide the entire error description. Compare this to the LabVIEW error handler:
Application Engineering Specialist | RF and Reconfigurable Test
You must be a registered user to add a comment. If you've already registered, sign in. Otherwise, register and sign in.


