- Document History
- Subscribe to RSS Feed
- Mark as New
- Mark as Read
- Bookmark
- Subscribe
- Printer Friendly Page
- Report to a Moderator
- Subscribe to RSS Feed
- Mark as New
- Mark as Read
- Bookmark
- Subscribe
- Printer Friendly Page
- Report to a Moderator
myDAQ mini-lab: V-I Characteristic II – Nonlinear devices
Course Linkage: Linear Circuit Analysis >> Voltage-Current Characteristic >> Nonlinear devices
Measurement Techniques: ELVISmx DMM (ohmmeter), custom LabVIEW VI
<hr width=”75%”>
Introduction
Overview: A voltage-current (V-I) characteristic visualizes the behavior of a two-terminal device: the device current is plotted as a function of the device voltage. The V-I characteristic plot provides valuable insight into the operation of a wide variety of electronic devices, especially nonlinear devices such as diodes, light-emitting diodes (LEDs), and incandescent light bulbs.
Objectives: In this mini-lab you will:
- Learn how to use a V-I curve tracer LabVIEW application
- Measure the terminal behavior of several types of diodes
- Measure the terminal behavior of several types of illuminators
Equipment
- NI myDAQ
- Breadboard
- Connecting wire
- Alligator clip test leads
- Texas Instruments (TI) TL072 op amp or similar device
- Resistors, ¼-W 5% carbon film: 10ohm
- Diode: 1N4148 or similar device
- Zener diode: 1N5232b (5-volt zener) or similar device
- Light emitting diode (LED)
- 5-volt incandescent light bulb
NOTE: Any dual-supply op amp is suitable for this project. Be sure to use the correct pin numbers, though, because these vary from one device to the next. Refer to the data sheet for your device (search www.datasheetcatalog.com) or ask your instructor for assistance.
Deliverables
- Submit your work in the form of a homework set problem or lab notebook entry according to the requirements of your instructor
- Submit your work for each underlined boldface item, and clearly label the item with its section letter and task number
A. Experience nonlinear device terminal behavior by measurement
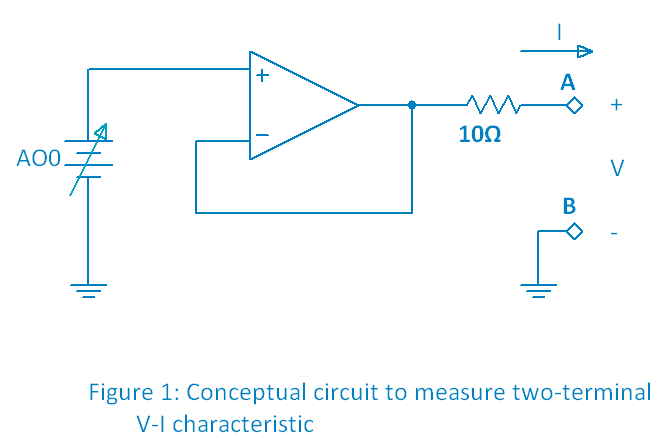
- Draw the circuit shown in Figure 1, the measurement setup for the V-I curve tracer. The 10-ohm resistor is called the "shunt resistor" in this application. The shunt resistor shares the same current as the two-terminal device connected between terminals A-B, therefore the shunt resistor voltage divided by the shunt's measured resistance provides a convenient way to measure the device current I with the myDAQ analog input. The op amp increases the current drive capability of the applied voltage from Analog Output 0 (AO0); see the myDAQ tutorial Increase analog output (AO) current drive for more information:
- Before you construct the circuit, set up the ELVISmx DMM as an ohmmeter and measure and record the resistance of each resistor.
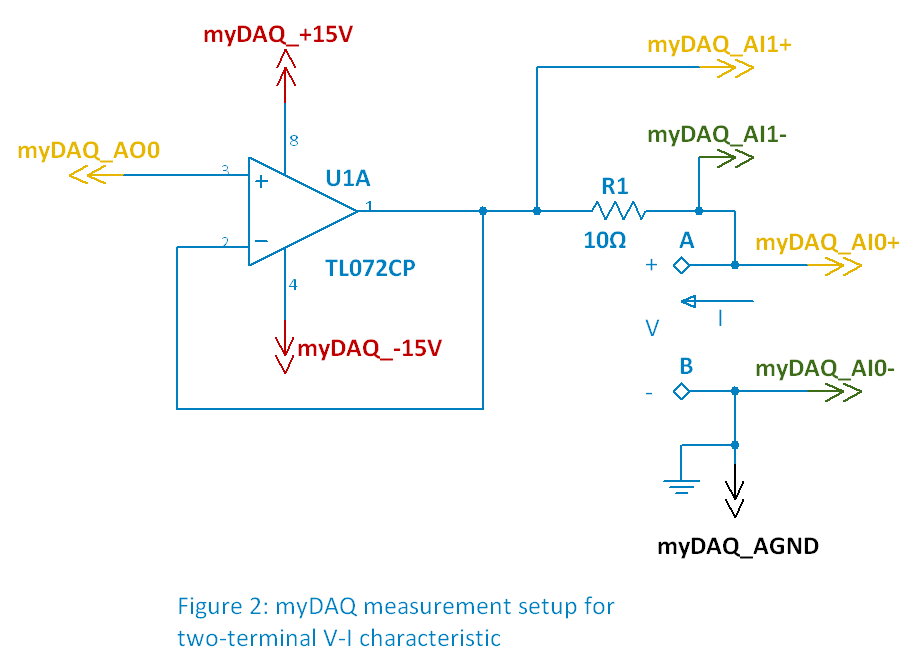
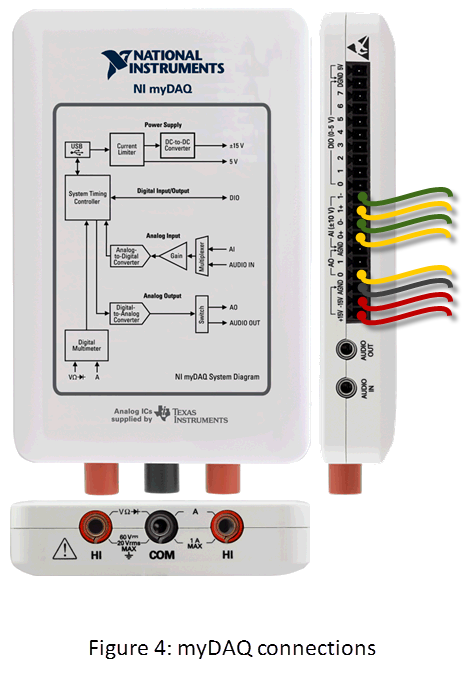
- Construct the circuit of Figure 2 with myDAQ and a breadboard; see Figure 3 for the recommended layout and Figure 4 for the myDAQ connections:

- Download and run the “V-I Curve Tracer” LabVIEW application linked at the bottom of this page.
- Set the plot window horizontal “V [volts]” limits to -10 V and +10 V; set the plot window vertical “I [amps]” limits to -0.05 and +0.05.
- Connect the diode between terminals A-B. Make sure that the terminal identified by the black stripe connects to terminal B.
- Plot the V-I characteristic and create a screenshot of the display.
- Repeat Steps 7 and 8 for the zener diode. Create a screenshot of the display.
- Repeat Steps 7 and 8 for the LED. If necessary, re-orient the device to make the V-I plot look similar to the plot for your diode. Create a screenshot of the display.
- Summarize your results so far: What do all of the V-I characteristic plots have in common? What is the distinguishing characteristic of each plot?
The following video shows expected results for the diode V-I characteristic:
B. Learn the underlying principles
The following video tutorial introduces the V-I characteristic plot as a means to visualize the behavior of nonlinear two-terminal devices such as diodes. Other meaningful interpretations of the V-I characteristic such as conductance and resistance are presented, too:
C. Connect the principles to your measurements:
- Connect the diode between terminals A-B. Measure and record the device voltage range for which the diode operates as an open circuit; note that the actual device voltage “AI0” is of interest here, not the applied voltage AO0. Also measure and record the voltage beyond which the diode abruptly begins to conduct current.
- Repeat Step 1 with the zener diode. Note that the zener diode as two distinct voltages at which the diode begins to conduct current. Record three items for this step.
- Repeat Step 1 with the LED; record two items for this step.
- Connect the incandescent light bulb between terminals A-B. Set the plot window horizontal “V [volts]” limits to -4 V and +4 V; set the plot window vertical “I [amps]” limits to -0.05 and +0.05.
- Set the applied AO0 voltage to -10 V, enable “persistence,” clear the plot if necessary, and set up an “Automatic Sweep” from -10 V to 10 V with 100 samples and click “Go.”
- Without changing AO0, set up an automatic sweep from 10 V back down to -10 V and click “Go.” Respond: What do you observe about the low-to-high path compared to the high-to-low path? If in doubt, try clearing the plot and try the sweeps again.
- You should be able to discern two regions, one in which the light bulb filament behaves like a relatively low resistance and another in which the resistance is higher. Respond: Does the incandescent light bulb filament have higher resistance when the filament glows or when it does not glow?
- Measure and record the “knee” voltage at which the filament just begins to glow (you may want to reduce the room lighting for this step).
- Study the V-I characteristic curve and estimate the resistance of the filament when it is cold (does not glow) and also estimate the filament resistance when it is hot (glows).
Build your intuition:
Reflect on the following points:
- Choose the correct response: The diode is analogous to a “check valve” that permits fluid or gas to flow in only one direction (see “check valve” at Wikipedia). In this context voltage is analogous to pressure. When electrical current flows easily through the diode, the device voltage (“pressure”) is relatively [ low | high ]. When electrical current does not flow easily through the diode, the device voltage (“pressure” again) is relatively [ low | high ].
- Choose the correct response: The effective resistance of an incandescent light bulb varies with temperature. The resistance is relatively [ low | high ] when the light bulb filament is hot and relatively [ low | high ] when the filament is cold.
For more information
- Mark as Read
- Mark as New
- Bookmark
- Permalink
- Report to a Moderator
Can you please suggest what changes should be done if NI USB-6009 is used instead?
- Mark as Read
- Mark as New
- Bookmark
- Permalink
- Report to a Moderator
How to export the measured values (GO button) to file?
- Mark as Read
- Mark as New
- Bookmark
- Permalink
- Report to a Moderator
thnx
- Mark as Read
- Mark as New
- Bookmark
- Permalink
- Report to a Moderator
.png")
.png")
Dear Authors, I need help and I Hope Community people may strike with this problem - I have tried out this circuit for my project, I would like to analyze the diode's I-V characteristics.
I did connections correctly, but I'm getting an error something like this. Does anybody help me to sort it out?
