- Subscribe to RSS Feed
- Mark Topic as New
- Mark Topic as Read
- Float this Topic for Current User
- Bookmark
- Subscribe
- Mute
- Printer Friendly Page
3D Intensity Graph ("3D Histogram") and Gaussian Fit for Pixel Detector
08-12-2013 10:57 PM - edited 08-12-2013 11:14 PM
- Mark as New
- Bookmark
- Subscribe
- Mute
- Subscribe to RSS Feed
- Permalink
- Report to a Moderator
Hello, LabVIEWers.
So... I have an output file from a pixel detector (256x256 pixels with a laser over some pixels) that gives me the X and Y coordinates and the Counting on each pixel ("X" "Y" "Value"). Pixels with Value = 0 are not printed.
I made a program that turns this output file into a 256x256 matrix with the respective values for each pixel (X and Y coordinates being the i,j matrix indexes).
With that I am ploting what I have in the detector as a map with the Intensity Graph. That's working perfectly.
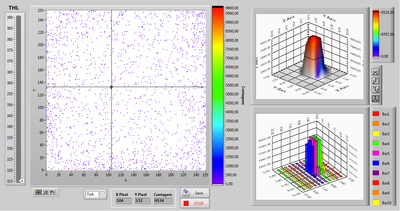
- I want to know if there is any way of make this intensity graph in 3D.
This 3D intensity graph is a zoom over the 2D (shows just the pixels where the laser is over and some others arround it). For that I'm just getting a submatrix from the original one (with all pixels).
I kind did it with 3D Bar Graph (lower right graph) but it's not what I'm trying to achieve. I'm attaching my Front Panel and the graphs (that I'm trying to do on LabVIEW) that I did on ROOT (CERN's object oriented framework) for reference.
Can somebody help me with that?
Then, I want to fit a Gaussian curve on this "3D histogram" and plot it (something like the upper right graph on my front panel).
I have searched a lot of topics over here talking about that... but I couldn't use what I found... they was using IMAQ and I don't know what it is.
Thanks in advance for any thoughts.
Best regards from Rio de Janeiro.
08-13-2013 06:17 PM
- Mark as New
- Bookmark
- Subscribe
- Mute
- Subscribe to RSS Feed
- Permalink
- Report to a Moderator
Any thoughts?
08-13-2013 06:30 PM
- Mark as New
- Bookmark
- Subscribe
- Mute
- Subscribe to RSS Feed
- Permalink
- Report to a Moderator
Please attach your actual VI.
08-13-2013 06:34 PM
- Mark as New
- Bookmark
- Subscribe
- Mute
- Subscribe to RSS Feed
- Permalink
- Report to a Moderator
That's what I get with your vi.
My .vi.
08-13-2013 07:20 PM
- Mark as New
- Bookmark
- Subscribe
- Mute
- Subscribe to RSS Feed
- Permalink
- Report to a Moderator
You have a problem with the old style ActiveX 3D controls (not sure how to fix this. Maybe repair the LabVIEW installation?).
Maybe you want to substitute the newer openGL based 3D graphs.
08-14-2013 01:50 PM - edited 08-14-2013 01:50 PM
- Mark as New
- Bookmark
- Subscribe
- Mute
- Subscribe to RSS Feed
- Permalink
- Report to a Moderator
You were right about my labVIEW installation.
I can use your .vi now.
I just can´t manage, yet, how use it.
I´m attaching the matrix and the (x y z) file that I need to fit.
Do you have any words about the 3D bar graph?
Thank you any way!


