- Subscribe to RSS Feed
- Mark Topic as New
- Mark Topic as Read
- Float this Topic for Current User
- Bookmark
- Subscribe
- Mute
- Printer Friendly Page
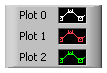
Showing a single complete plot symbol in a plot legend, e.g. for scatter plots
06-11-2008 03:19 AM
- Mark as New
- Bookmark
- Subscribe
- Mute
- Subscribe to RSS Feed
- Permalink
- Report to a Moderator

Is there any way to show the first symbol both correctly centered (vertically) in the legend, as well as not cut off? Second, is there any way to disable the "zig-zag" pattern, and thus have all points in a given legend appear on a straight horizontal axis? This is particularly useful for generating publication quality figures.
Thanks, Lyle
06-11-2008 10:17 AM - edited 06-11-2008 10:17 AM
- Mark as New
- Bookmark
- Subscribe
- Mute
- Subscribe to RSS Feed
- Permalink
- Report to a Moderator
I suppose a workaround is to draw your own legend using a picture control.
Message Edited by smercurio_fc on 06-11-2008 10:17 AM
06-11-2008 10:31 AM
- Mark as New
- Bookmark
- Subscribe
- Mute
- Subscribe to RSS Feed
- Permalink
- Report to a Moderator
06-11-2008 10:39 AM
- Mark as New
- Bookmark
- Subscribe
- Mute
- Subscribe to RSS Feed
- Permalink
- Report to a Moderator
Thanks,
Lyle
06-11-2008 10:44 AM
- Mark as New
- Bookmark
- Subscribe
- Mute
- Subscribe to RSS Feed
- Permalink
- Report to a Moderator
06-11-2008 10:50 AM
- Mark as New
- Bookmark
- Subscribe
- Mute
- Subscribe to RSS Feed
- Permalink
- Report to a Moderator
06-11-2008 11:07 AM
- Mark as New
- Bookmark
- Subscribe
- Mute
- Subscribe to RSS Feed
- Permalink
- Report to a Moderator
06-11-2008 11:13 AM
- Mark as New
- Bookmark
- Subscribe
- Mute
- Subscribe to RSS Feed
- Permalink
- Report to a Moderator
smercurio's suggestion to use a picture control is the way to go if you REALLY need to change from zig-zag to straight. In fact you can build on that idea by using an invoke node "get image" of an off-screen gragh with its legend showing then pull out the portion that shows the legend. Still using the picture functions over-lay the zig-zag with your straight line version and then update you picture. Of course this means you will have to code up all of the plot property functionality yourself.
Ben
06-11-2008 11:28 AM
- Mark as New
- Bookmark
- Subscribe
- Mute
- Subscribe to RSS Feed
- Permalink
- Report to a Moderator
Thus, I find that one can generate figures that are *very* close to professional, yet a few details seem elusive. As but one example, I have never seen a graph in a journal article with a legend that imparts any geometry (such as the "zig-zag") other than a straight line. How can this be considered a "feature"?
Any philosophical/practical observations welcome.
Lyle
06-11-2008 12:26 PM
- Mark as New
- Bookmark
- Subscribe
- Mute
- Subscribe to RSS Feed
- Permalink
- Report to a Moderator
The zig-zag pattern has the advantage that it shows you what your plot will look like when toggling the various options (e.g. antialiasing, point styles, fills, etc.)
There are VIs in the picture palettes for creating graphs in picture controls. They include code for creating legends.
___________________
Try to take over the world!
