- Subscribe to RSS Feed
- Mark Topic as New
- Mark Topic as Read
- Float this Topic for Current User
- Bookmark
- Subscribe
- Mute
- Printer Friendly Page
Placing a "label" on the graph area
03-09-2015 07:58 AM
- Mark as New
- Bookmark
- Subscribe
- Mute
- Subscribe to RSS Feed
- Permalink
- Report to a Moderator
Hello Everybody, I am new here but not quite new to LV. I seem to have a fundamental problem with the UI updates:
In my project I need to place some kind of a "label" inside of a x-y graph (within the plot area as there is no room elswhere). This is basically doable but whatever I try it makes the graphs update much slower and with much higher processor usage (2.5x, in my case an increase from 12% to 30%). I've tried using a string control, string decoration, caption - whenever the object is within the graph the update speed/responsiveness of the graph decreases significantly.
Now I know it is been told somewhere one should not place objects within a graph just because of the obove reasons but I really need a kind of label in the plot area.
The graphs are updated 9-10 times per second with 4x100 points, I am writing directly to the graph control, not using property nodes.
Is there any chance to get this functionality working without such significant performance drawbacks?
Thanks in advance for your answers.
03-09-2015 08:05 AM
- Mark as New
- Bookmark
- Subscribe
- Mute
- Subscribe to RSS Feed
- Permalink
- Report to a Moderator
03-09-2015 08:32 AM
- Mark as New
- Bookmark
- Subscribe
- Mute
- Subscribe to RSS Feed
- Permalink
- Report to a Moderator
Thanks for this suggestion, I almost looks like it must work for the job (have not tried out yet though).
However it makes me realize that I missed one point in the explanation of my problem above - the graphs are placed on unvisible tab controls that switch between graphs and some clusters of other data. I thought I could have an "object" placed over (on top of) the whole tab so that the label remains consistent regardless of the tab selection. In this case an annotation is obviously strictly a graph atribute. I would have to "mimic" it for the other tab pages/clusters).
03-09-2015 08:51 AM
- Mark as New
- Bookmark
- Subscribe
- Mute
- Subscribe to RSS Feed
- Permalink
- Report to a Moderator
There is another limitation with annotation as I can see: it seems their attributes cannot be modified programatically, except for the text as such(?). I need to have the label change color to indicate highlighting of user selection.
03-09-2015 08:54 AM
- Mark as New
- Bookmark
- Subscribe
- Mute
- Subscribe to RSS Feed
- Permalink
- Report to a Moderator
03-09-2015 09:03 AM
- Mark as New
- Bookmark
- Subscribe
- Mute
- Subscribe to RSS Feed
- Permalink
- Report to a Moderator
True, but it is only annotation text that can be accessed through property node programatically, unless I am missing something obvious...
03-09-2015 09:05 AM
- Mark as New
- Bookmark
- Subscribe
- Mute
- Subscribe to RSS Feed
- Permalink
- Report to a Moderator
03-09-2015 09:15 AM
- Mark as New
- Bookmark
- Subscribe
- Mute
- Subscribe to RSS Feed
- Permalink
- Report to a Moderator
True:)
This array of clusters just looked like an array of strings with the Context Help switched off... Thank you for opening my eyes:)
Keeping that in mind as a useful backup solution: isn't there any way to place an object over plot area on top of all of the UI elements so that it does not interfere with graph updates?
03-09-2015 09:17 AM
- Mark as New
- Bookmark
- Subscribe
- Mute
- Subscribe to RSS Feed
- Permalink
- Report to a Moderator
No,
whatever you place over plot area of a graph will interfere with UI updates.
Whenever you want to display new data LabVIEW needs to draw the graph and subsequently the overlaid item too…
Lesson learned: open and read the context help ![]()
03-09-2015 09:25 AM
- Mark as New
- Bookmark
- Subscribe
- Mute
- Subscribe to RSS Feed
- Permalink
- Report to a Moderator
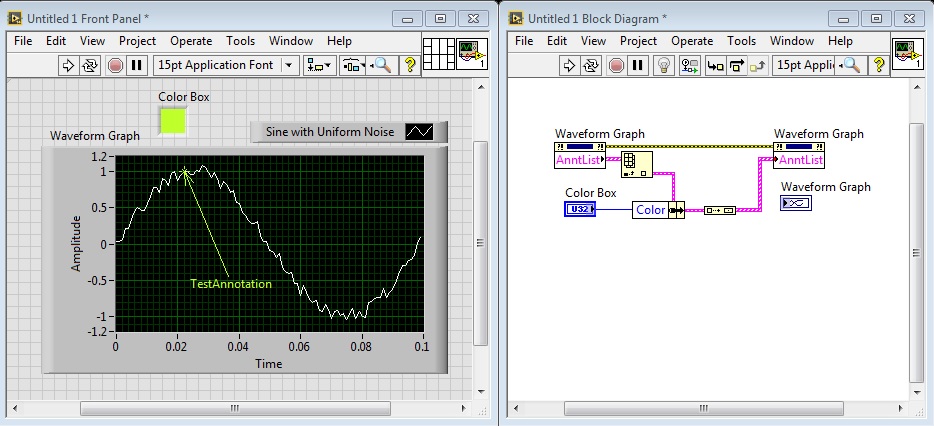
You can change the colour, this little VI worked fine for me:

But to have the annotation appear in the same place on the UI for multiple tabs would mean creating an identical one on all your plots. However, that's not hard as they are programmatically settable. You can create one annotation definition and set the "AnnList" property on each graph in each page of your tab container.
Going back to your original problem, sounds like you have a floating string control over your tab. That's always been known to be hard on the LabVIEW graphics engine, and will slow down your refresh rate/increase CPU usage.
Consider:
1. Multiple strings (one per tab, in the same place, with the same content)
2. Cloning the annotation properties across all graphs.
Note: There are peculiarities when setting annotations programmatically, especially if you replot the graph content - the annotation can disappear. Take care when setting these.
