- Subscribe to RSS Feed
- Mark Topic as New
- Mark Topic as Read
- Float this Topic for Current User
- Bookmark
- Subscribe
- Mute
- Printer Friendly Page
Dashboard Tile to Emulate Trend Plots using Jupyter Notebooks
02-07-2023 08:37 AM - edited 02-07-2023 09:10 AM
- Mark as New
- Bookmark
- Subscribe
- Mute
- Subscribe to RSS Feed
- Permalink
- Report to a Moderator
I've been creating a custom Jupyter notebook to generate an output which emulates the type of plotting which can be done with the Trend Analysis functionality within SystemLink. This is because we have an interest in creating dashboard tiles which are dynamic versions of some those trend analysis plots. Since there's no way to export notebooks of those plots like there are for reports, we tried to go the Jupyter route. On a general basis, we want to trend across a particular tests for all serial numbers of a unit under test.
I'll preface that we currently are not rolling out grafana in our environment... I've heard and seen in the forums that some of this desired capability may be easier to achieve utilizing it, but we unfortunately don't have that at our disposal right now. Also, we are currently using SystemLink Server version 2021 R3.
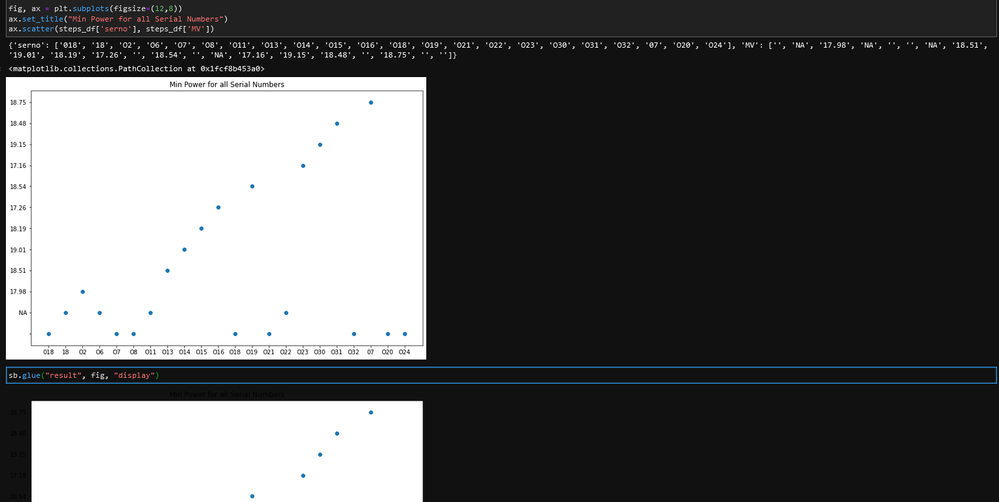
With that being said, I've been able to successfully create a pandas data frame using a combination of the results API and steps API to query the results, and steps for those results respectively. Then I correlate the specific serial number to the particular step. I am able to generate a plot output which is more or less what I'd like to have as my dashboard tile using matplotlib, however when I try to either glue that matplotlib plot to my scrapbook output, or utilize the same SystemLink specific output highlighted here I get no output on my dashboard tile. I've also tried going off of some examples in Git and other Jupyter notebooks that I've been able to successfully link to tiles, but don't see where I'm going wrong with this one.
Here's the matplotlib plot that I am able to successfully generate and how I'm gluing to the scrapbook:
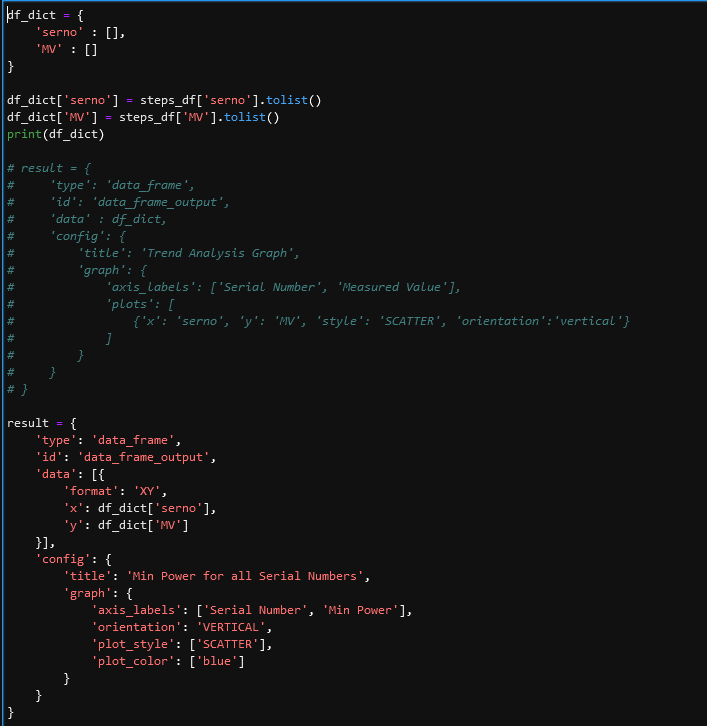
Here's the methods that I've tried using based on the SystemLink examples both in the documentation and that I've found on Git (I've tried utilizing 2 different methods, as well as converting my data frame to a dict, changing the type/ids, etc. all result in the same lack of output):
This gets glued with "sb.glue("result", result)" (no "display", was only using that for debugging / for when I tried to glue the matplotlib output)
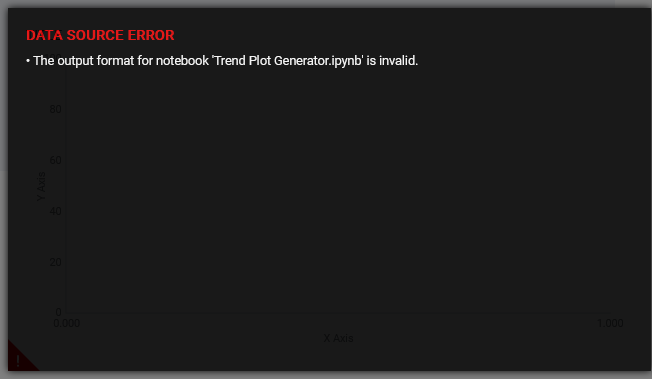
Finally, here's what my tile looks like regardless of which plotting / gluing methodology I'm utilizing:
I've most recently gotten my tile to look like this (running/ trying to output infinitely, at least no warnings anymore!):
Any help / ideas would be extremely appreciated!
02-20-2023 11:13 AM
- Mark as New
- Bookmark
- Subscribe
- Mute
- Subscribe to RSS Feed
- Permalink
- Report to a Moderator
Hey Devon,
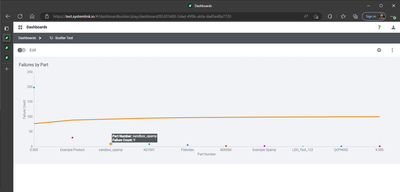
I'm not exactly sure what's going on with your script below, but I was able to quickly adapt the output of the 'Failure Pareto - Results' notebook to output a scatterplot and load it in a dashboard:
All I had to modify from the example was to change the type from BAR to SCATTER.
pareto_graph = {
    'type': 'data_frame',
    'id': 'failure_pareto_results_graph',
    'data': df_dict,
    'config': {
        'title': 'Failure Pareto - Results by {}'.format(group_by),
        'graph': {
            'axis_labels': [group_by, 'Failure Count', 'Cumulative %'],
            'plots': [
                {'x': grouping, 'y': 'fail_count', 'style': 'SCATTER', 'group_by': [grouping]},
                {'x': grouping, 'y': 'cumulative', 'secondary_y': True, 'style': 'LINE'}
            ],
            'orientation': 'VERTICAL'
        }
    }
}
More important than the graph output metadata is probably the data format we're outputting. Have you tried setting up the dataframe like this, where you specify the columns and values:
df_dict = {
    'columns': pd.io.json.build_table_schema(df_pareto, index=False)['fields'],
    'values': df_pareto.values.tolist(),
}
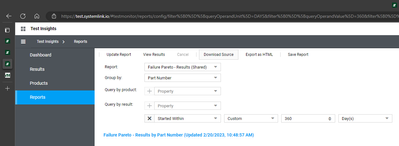
Unfortunately it won't let me upload the notebook here directly, but you can get a copy of it via the 'Download Source' button in the Reports section of the Test Insights Application.
TJ G
