- Document History
- Subscribe to RSS Feed
- Mark as New
- Mark as Read
- Bookmark
- Subscribe
- Printer Friendly Page
- Report to a Moderator
- Subscribe to RSS Feed
- Mark as New
- Mark as Read
- Bookmark
- Subscribe
- Printer Friendly Page
- Report to a Moderator
Debugging Release Executables
Everybody is probably familiar with and comfortable using a debugger to find out what went wrong in your code. But what do you do when you cannot use a debugger? Some problems only occur in release executables that you cannot debug; other problems occur only when specific hardware is installed on your machine and the debugger might not be available. LabWindows/CVI includes tools to help you debug in these scenarios.
Executive Summary
- Which EXE or DLL did the crash occur in?
- View loaded modules list in the LabWindows/CVI debugger
- Where in the EXE or DLL did the crash occur?
- Generate a map file for the EXE or DLL
- Look up the address in the map file
- Trace the execution of your EXE or DLL
- Use DebugPrintf
Loaded Modules
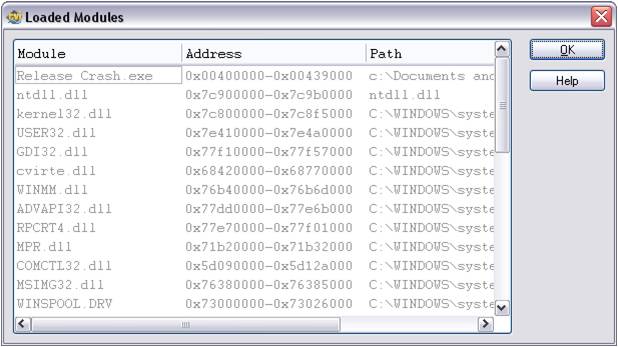
If your project consists of several DLLs, the first step is to find out which DLL the error occurred in. The LabWindows/CVI debugger keeps a list of all loaded modules together with the address range into which they were loaded. The list also includes the full path for each DLL so you can ensure that the correct version of that DLL was loaded.
Generate Map Files
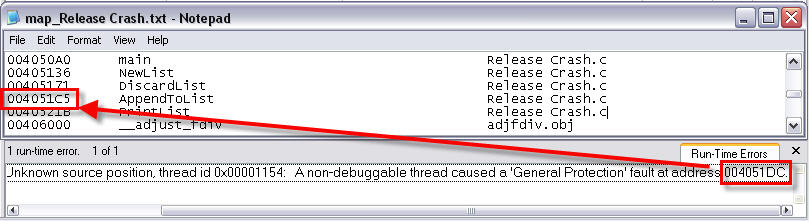
Once you know which module the crash occurred in you need to find out where in that module it occurred. You can ask LabWindows/CVI to generate a map file by selecting the corresponding option in the Target Settings dialog box. A map file associates every function defined and used in an executable with its address in memory. You should generate a map file only when you actually need it for debugging because it takes some time to generate the map file during the build process.
DebugPrintf
You cannot step through the release executable code directly in CVI, but you can insert DebugPrintf statements to trace the execution of your code and to print variable values. The output appears in the Debug Output window of the LabWindows/CVI debugger.
Exercise 1
Launch LabWindows/CVI and load Exercise1\Release Crash.prj.
Compile the project in debug configuration and run it. It will work fine.
Compile the project in release configuration and run it. It will crash (A non-debuggable thread caused a 'General Protection' fault at address xxxxxxx). Look up the address in the Loaded Modules list, accessible through the Window Menu (LabWindows/CVI 9.0 and later) or Run Menu (LabWindows/CVI 8.5 and earlier). Notice the full path for each loaded module with which you can verify that you have loaded the correct version of your module.
In the Build\Target Settings dialog box select Generate Map File and rebuild your executable. Run the release configuration again to obtain the address where it crashes. Note: You need to run your executable again because the order in which instrument drivers and libraries are loaded into LabWindows/CVI affects the order in which they are linked. Rebuilding your executable might have changed the internal layout of your program. Because of a limitation in the generation of object files in release configuration, map files will not contain entries for static functions and variables unless you recompile the files containing these functions and variables. Selecting the Generate map file option automatically forces LabWindows/CVI to recompile your C files.
Look up the address of the crash (A non-debuggable thread caused a 'General Protection' fault at address xxxxxxx) in the map file to find the function the crash occurred in. LabWindows/CVI generates the map file in the cvibuild.projectname directory under the main project directory. The file is named map_projectname.txt if you create a release executable or map_projectname_dbg.txt if you create a debuggable executable.
(Continuing the previous example.) Open the source file in the project.
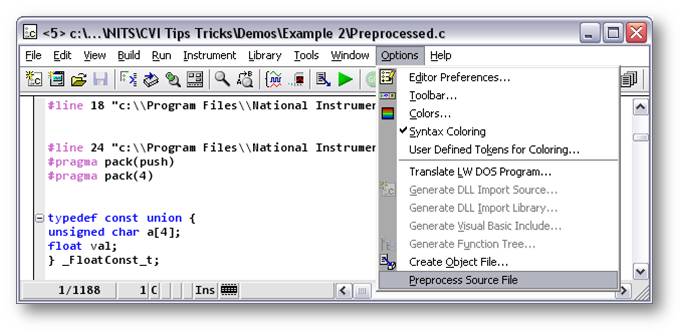
Select Options>>Preprocess Source File to generate the preprocessed output.
Switch to the other configuration (release or debug) and generate the preprocessed output again.
Use LabWindows/CVI to diff (Edit\Diff\Find Next Difference) the two files. You will notice that all the asserts are missing in release configuration. You will also notice that some of the asserts have side effects (memory allocation) and that this is causing the problem.
FAQ: Why does my project work in debug mode but not in release mode?
Naturally, there can be several reasons for this. The most common cause is conditional compilation. You might inject sanity checks and other debugging code in your program that you do not need in the final version of your code. This is good programming practice, but you need to be careful that your debugging code does not have any side effects that the rest of the program relies on.
A simple check involves generating the preprocessor output for the release and the debug version of your code and comparing the two. You also can insert special preprocessor directives in your code or look at the preprocessor output directly to verify that your macros expand the way you expect.
Exercise 2
LabWindows/CVI Developer Newsletter
