- Subscribe to RSS Feed
- Mark Topic as New
- Mark Topic as Read
- Float this Topic for Current User
- Bookmark
- Subscribe
- Mute
- Printer Friendly Page
timing, ploting data
Solved!02-26-2013 06:46 AM
- Mark as New
- Bookmark
- Subscribe
- Mute
- Subscribe to RSS Feed
- Permalink
- Report to a Moderator
Hi all,
I'm working on my Diploma work and I need help with some problems. I want to try acquire some data from my system using Labview insted of matlab /simulink. I need only some simple function's to acquire and plot data.
I have my system connected to the NI USB 6009. After start program I want to acquire output of system (it's working) plot it (working) but there comes problem in single graph i want to plot system output and NI USB 6009 output (now I'm doing it in 2 separate graph's) step response. I find out, that can be done with using array but it does not work for me... Collected data written in excel worsheet (date/time and system output). There I want to write into the worksheet only 3 columns, 3 values : " time in seconds | NI USB6009_output | sys_output"
Can anyone help ? I know this problems are simple, but I'm beginner and time is running up really fast.
output of system is affected by noise, so i want to build lowpass filter out of while loop (i create this filter in another VI project). With connected filter final structure of worksheet would by like: " time in seconds | NI USB6009_output | sys_output | sys_ouput_filtered".
Sorry for my english and thanks for answers.
Best regards
Paul.
Solved! Go to Solution.
02-26-2013 10:11 AM
- Mark as New
- Bookmark
- Subscribe
- Mute
- Subscribe to RSS Feed
- Permalink
- Report to a Moderator

Although you convert the scalor to an array, you are passing a single point to the Waveform Chart, so you won't see anything.
I did not get a mental picture of what you want to achieve, just bits of information, but I do not understand why you needed 2 separate graphs.
Maybe the best approach is to fix one problem at a time.. ...maybe...
03-20-2013 06:36 AM
- Mark as New
- Bookmark
- Subscribe
- Mute
- Subscribe to RSS Feed
- Permalink
- Report to a Moderator
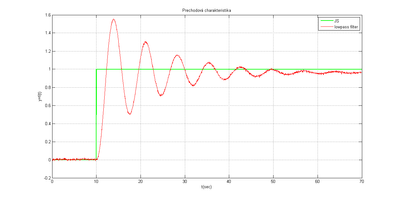
I want to plot 2 diffrent types of signal into single waveform Graph as it is described at the picture.
On the graph i want to have 2 curves: AI and AO.
something like that:
03-24-2013 08:22 PM - edited 03-24-2013 08:22 PM
- Mark as New
- Bookmark
- Subscribe
- Mute
- Subscribe to RSS Feed
- Permalink
- Report to a Moderator
You were close to the solution, but using the wrong function. Appending the waveforms will display one then the other.
To superimpose, first create an array and use the function Align Waveform Timing.
See image below:
03-25-2013 03:20 AM
- Mark as New
- Bookmark
- Subscribe
- Mute
- Subscribe to RSS Feed
- Permalink
- Report to a Moderator
Thanks a lot, I changed it upon your suggestion and it works! (not precisely what i want but close enough) Thanks.
03-25-2013 07:55 AM
- Mark as New
- Bookmark
- Subscribe
- Mute
- Subscribe to RSS Feed
- Permalink
- Report to a Moderator
Hi Pavol,
I am trying to understand what you are doing. You are merging signals from the bottom with the signals from previous iterations, while superimposing with a new signal (from the signal express above).
Can you describe what you intended to obtain? It might be a simple "tweek" to your code.
If you find posts useful, you can always give Kudos 😉
03-25-2013 08:50 AM - edited 03-25-2013 08:50 AM
- Mark as New
- Bookmark
- Subscribe
- Mute
- Subscribe to RSS Feed
- Permalink
- Report to a Moderator
I have connected system to the PC by NI USB 6009. I want to get output (ao) and input (ai) of connected system, those two variables i want to put into the graph in-time.
Unit Step Response with unit step.
Try to look, maybe it helps you to get some idea what i want to get.
All I want is to get ai and ao of system in same data type and size and put them into to graph.
Sorry for my english.
03-25-2013 09:15 AM
- Mark as New
- Bookmark
- Subscribe
- Mute
- Subscribe to RSS Feed
- Permalink
- Report to a Moderator
I have not looked at the video yet. THe code example I provided earlier should have done what you are looking for.


