- Subscribe to RSS Feed
- Mark Topic as New
- Mark Topic as Read
- Float this Topic for Current User
- Bookmark
- Subscribe
- Mute
- Printer Friendly Page
plotting XY graphs - with negative numbers
04-05-2008 05:01 PM
- Mark as New
- Bookmark
- Subscribe
- Mute
- Subscribe to RSS Feed
- Permalink
- Report to a Moderator
i have two arrays..
the array A and B
i connected the 2 arrays with XY graph, because i want to plot the data contains to the two arrays
the problem is that the XY graph don't plot the negative elements...
why??
thanks a lot!!
andrikos
04-05-2008 05:55 PM - edited 04-05-2008 05:56 PM
- Mark as New
- Bookmark
- Subscribe
- Mute
- Subscribe to RSS Feed
- Permalink
- Report to a Moderator

Message Edited by Jorge Amaral on 04-05-2008 05:56 PM
www.mcm-electronics.com
PORTUGAL
04-05-2008 07:14 PM
- Mark as New
- Bookmark
- Subscribe
- Mute
- Subscribe to RSS Feed
- Permalink
- Report to a Moderator
Please attach a simplified version of your code and some data.
Some things to check:
- Set the axes to autoscaling to make sure all data shows
- I assume A=X and B=Y. Are both arrays the same lenght?
- Are you using the express XY graph?
04-06-2008 01:57 PM
- Mark as New
- Bookmark
- Subscribe
- Mute
- Subscribe to RSS Feed
- Permalink
- Report to a Moderator
the arrays have the same length
i have the autoscale and it don;t plot the negative elements..
y?
is the same type of arrays..
thanks!
andrikos
04-06-2008 02:56 PM
- Mark as New
- Bookmark
- Subscribe
- Mute
- Subscribe to RSS Feed
- Permalink
- Report to a Moderator
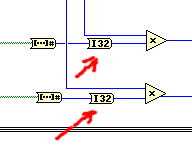
Something is missing on your code image, because you have indicators on both sides and no data source. We cannot see where the data is coming from!
What are the datatytpes of the various wires? (enable the context help and hover over the wires)
Please attach your real code, it is impossible to tell from a picture what's wrong.
04-06-2008 03:34 PM
- Mark as New
- Bookmark
- Subscribe
- Mute
- Subscribe to RSS Feed
- Permalink
- Report to a Moderator
and now..
i attach the whole program..
the programm has 3 stages.
in the first stage i take the data from an optical mouse.. about movements and the buttons..
in the second stage i decode the data
in the third stage, i plot the movement of the mouse
in the two arrays i have the X and Y movements..
thanks!
andrikos
04-06-2008 04:18 PM
- Mark as New
- Bookmark
- Subscribe
- Mute
- Subscribe to RSS Feed
- Permalink
- Report to a Moderator
Looks like your arrays are possibly unsigned integers (U32) which don't have negative numbers.
Data representation is a mess in general. Look at all the the coercion dots. You are using I32 and U32 indicators on the same wire!
(Your sequence structure has no purpose and only complicates the code.. You can delete it with no change in outcome. You could use autoindexing at the FOR loop. You could use a single "index array" resized to the desired number of outputs instead of all these instances, etc... Your "integration" code is very convoluted and does way to many calculations.)
It really would be much easier if you would attach the actual VI! Thanks. 🙂
04-06-2008 06:07 PM
- Mark as New
- Bookmark
- Subscribe
- Mute
- Subscribe to RSS Feed
- Permalink
- Report to a Moderator
but i have the same problem again..
it don't plot the negative elements..
i attach the vi.. 🙂
pls.. help me..
thanks a lot!
andrikos
04-06-2008 07:02 PM - edited 04-06-2008 07:03 PM
- Mark as New
- Bookmark
- Subscribe
- Mute
- Subscribe to RSS Feed
- Permalink
- Report to a Moderator
Message Edited by altenbach on 04-06-2008 05:03 PM
04-06-2008 10:59 PM
- Mark as New
- Bookmark
- Subscribe
- Mute
- Subscribe to RSS Feed
- Permalink
- Report to a Moderator
Please don't upload large bitmap files with your message.
andrikoscy wrote:
i attach a photo from the block diagram..
