- Subscribe to RSS Feed
- Mark Topic as New
- Mark Topic as Read
- Float this Topic for Current User
- Bookmark
- Subscribe
- Mute
- Printer Friendly Page
find frequency from input signal
03-29-2006 08:22 AM
- Mark as New
- Bookmark
- Subscribe
- Mute
- Subscribe to RSS Feed
- Permalink
- Report to a Moderator
03-29-2006 08:29 AM
- Mark as New
- Bookmark
- Subscribe
- Mute
- Subscribe to RSS Feed
- Permalink
- Report to a Moderator
Load the text data into an array and build a waveform from it (dt is the known time interval), then you can use all the precanned waveform analysis functions to fine a whole heap of information including the frequency.
03-29-2006 08:55 AM
- Mark as New
- Bookmark
- Subscribe
- Mute
- Subscribe to RSS Feed
- Permalink
- Report to a Moderator
03-29-2006 09:47 AM
- Mark as New
- Bookmark
- Subscribe
- Mute
- Subscribe to RSS Feed
- Permalink
- Report to a Moderator
03-29-2006 10:01 AM
- Mark as New
- Bookmark
- Subscribe
- Mute
- Subscribe to RSS Feed
- Permalink
- Report to a Moderator
03-29-2006 10:11 AM - edited 03-29-2006 10:11 AM
- Mark as New
- Bookmark
- Subscribe
- Mute
- Subscribe to RSS Feed
- Permalink
- Report to a Moderator
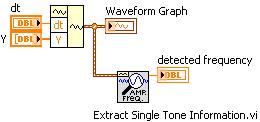
Of course. You can use the Build Waveform function to create a waveform data type and wire that to both the graph and frequency function.
Message Edited by Dennis Knutson on 03-29-200609:12 AM
04-16-2006 11:59 AM
- Mark as New
- Bookmark
- Subscribe
- Mute
- Subscribe to RSS Feed
- Permalink
- Report to a Moderator
04-17-2006 08:12 AM
- Mark as New
- Bookmark
- Subscribe
- Mute
- Subscribe to RSS Feed
- Permalink
- Report to a Moderator
04-17-2006 08:28 AM
- Mark as New
- Bookmark
- Subscribe
- Mute
- Subscribe to RSS Feed
- Permalink
- Report to a Moderator
If it is one or more fixed frequencies, then the simple Fourier transform based functions will work. If it is one or more frequencies that vary over time, then some other algorithms will be required.
Can you describe your data in a little more detail or better yet post it?
04-24-2006 12:13 PM
- Mark as New
- Bookmark
- Subscribe
- Mute
- Subscribe to RSS Feed
- Permalink
- Report to a Moderator
