- Subscribe to RSS Feed
- Mark Topic as New
- Mark Topic as Read
- Float this Topic for Current User
- Bookmark
- Subscribe
- Mute
- Printer Friendly Page
delete columns in excel
01-25-2008 06:36 AM
- Mark as New
- Bookmark
- Subscribe
- Mute
- Subscribe to RSS Feed
- Permalink
- Report to a Moderator
Relative Time;S1;S2;S3;S4;S5;S6;S7;S8;;;;;;;;;;;;;;;;;;;;;;;;
00:00:00;-0,077;0,117;-0,016;-0,049;-0,000;-0,067;-0,254;-0,406;0,000;0,000;0,000;0,000;0,000;0,000;0,000;0,000;0,000;0,000;0,000;0,000;0,000;0,000;0,000;0,000;0,000;0,000;0,000;0,000;0,000;0,000;0,000;0,000
00:00:01;-0,077;0,117;-0,016;-0,049;-0,000;-0,067;-0,254;-0,406;0,000;0,000;0,000;0,000;0,000;0,000;0,000;0,000;0,000;0,000;0,000;0,000;0,000;0,000;0,000;0,000;0,000;0,000;0,000;0,000;0,000;0,000;0,000;0,000;blahblah
01-26-2008 03:26 AM
- Mark as New
- Bookmark
- Subscribe
- Mute
- Subscribe to RSS Feed
- Permalink
- Report to a Moderator
Hi anders
i think the first way is better, because the function to select the useful data is in your program and if you ever change your output format the selection is still existing.
Mike
01-28-2008 08:38 AM - edited 01-28-2008 08:40 AM
- Mark as New
- Bookmark
- Subscribe
- Mute
- Subscribe to RSS Feed
- Permalink
- Report to a Moderator
Okay, seems like I ran into some trouble...
I thought all I had to do was to read it back in with read from spreadsheet file, but all my timestamps were then gone.
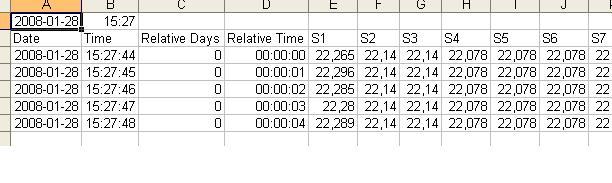
Below are some screenshots, all I did was to read it with read to spreadsheet VI with file input and semicolon as separator, and then selected subarrays and formatted them as they were saved. (see excel import), but all I get i jibberish. Suggestions?

Message Edited by Tohatsu on 01-28-2008 08:40 AM
01-28-2008 08:55 AM
- Mark as New
- Bookmark
- Subscribe
- Mute
- Subscribe to RSS Feed
- Permalink
- Report to a Moderator
02-01-2008 05:04 AM
- Mark as New
- Bookmark
- Subscribe
- Mute
- Subscribe to RSS Feed
- Permalink
- Report to a Moderator
reading them as string worked excellent, since I dont have to interpret the data, but only filter out the unwanted parts, it made my day 😄
On the semicolon part, there are several reasons:
1) Semicolon is not used anywhere in the data
2) to avoid the problem with some having comma as decimal separator and some having dot (user speciffic settings)
3) to make the file readable "to the eye" as a long sensorname would shift everything one column if I used tab separator.
oh, and time-values are not separated by semicolon, it's separated by colon.
But thankyou for the good solution!
Anders
