- Subscribe to RSS Feed
- Mark Topic as New
- Mark Topic as Read
- Float this Topic for Current User
- Bookmark
- Subscribe
- Mute
- Printer Friendly Page
cRIO scan engine rate
09-20-2013 12:30 PM - edited 09-20-2013 12:59 PM
- Mark as New
- Bookmark
- Subscribe
- Mute
- Subscribe to RSS Feed
- Permalink
- Report to a Moderator
LV 2012
cRIO 9024
I am an intermediate LV user, and am developing a control system using the built-in RT control template provided with LV. I am somewhat new to RT programming, but have manage to piece my way through most of what the template does. I have a 9204 cRIO with all eight chassis modules full (1x serial and 7x 4-20mA input).
From my project explorer window, I have set the 9024 scan engine properties to 25ms for scan period and 25ms for network publishing period. However, when I read the IO variable values from my UI VI on the host computer, the values only update every 800-1000ms even though my read loop is running with a period of about 200ms. If I set the scan period and network publishing periods to 10000ms, the indicators on my host machine VI do show the decrease in update rate, but setting the periods lower doesn't get the updates rate above the 800-1000ms range. With the host machine VI running, all of the indicators update values together in sync with each other, all at roughly 1 Hz. I have measured my display update loop period to confirm that it is in fact updating every 200ms.
Any suggestions? From what I've ready of the scan engine, it seems like the IO variable values should be updating at the rate dictated by the scan engine period. Total IO count on the 9024 is roughly 120 points.
Thanks in advance!!
09-22-2013
10:38 AM
- last edited on
12-30-2025
01:10 PM
by
![]() Content Cleaner
Content Cleaner
- Mark as New
- Bookmark
- Subscribe
- Mute
- Subscribe to RSS Feed
- Permalink
- Report to a Moderator
Hi,
I don't have intimate knowledge of CompactRIO systems, but I'll give it a shot.
Open up the Distributed System Manager (DSM) and have a look at your cRIO's CPU load while your GUI is trying to read the network published values. Is it maxing out? A high scan rate, high network publishing rate and high channel count all contribute to CPU load -- your cRIO might not be able to keep up. See this page for some measurements (although the controller they used is weaker than yours)
While you're there, have a look at your I/O Variables through the DSM as well. Are the update rates any better than your GUI? (The DSM graphs update every ~250 ms)
If that's still not the issue, double-check that your variables are not buffered. I'm pretty sure that I/O Variables are unbuffered; can you confirm that you're not using a buffered Shared Variable instead? If you use a buffer but the reader is consistently slower than the writer, you'll be seeing stale values all the time. You said you're reading it every 200ms -- a 1000ms lag suggests that you're getting data from 5 samples ago.
09-24-2013 06:45 PM
- Mark as New
- Bookmark
- Subscribe
- Mute
- Subscribe to RSS Feed
- Permalink
- Report to a Moderator
Thanks for the response. Sorry for my delay, but I broke my code and it took me a few days to find time to find and fix the problem. ![]()
So, in DSM the update rate matches the update in my GUI (roughly 1.14Hz during my test). The CPU load is hovering right around 42%.
I checked the properties of the IO variables in my project explorer, and the buffering / FIFO option is greyed out.
I've been wondering if I need to somehow drive the variable update in the RT time-critical loop since I can't seem to get the scan engine to speed up?
Any other ideas out there?
Thanks again in advance!
09-25-2013
06:59 PM
- last edited on
12-30-2025
01:11 PM
by
![]() Content Cleaner
Content Cleaner
- Mark as New
- Bookmark
- Subscribe
- Mute
- Subscribe to RSS Feed
- Permalink
- Report to a Moderator
Hi Cameron,
How have you been verifying that the reading loop (I'm guessing you mean the Monitoring Loop) on your UI Main.vi is happening in 200ms? Also, it's possible your scan engine's update rate is limited by your application logic. This article goes a bit more in depth about how your scan engine period relates to the rest of your program. Have you tried removing unnecessary logic from the real-time portions of your code?
As another note, it would be good to know which VI you're reading your variables in. For example if you're using the RSI Low Speed.vi to read them in, this VI has a timed loop that is set to execute every 20 scans, which would be 500 ms at a Scan Rate of 25ms. Could you post a screenshot of your code where you are reading in these values?
I hope this helps!
Emerson Test & Measurement Group
Senior System Support Engineer
09-26-2013 09:10 AM
- Mark as New
- Bookmark
- Subscribe
- Mute
- Subscribe to RSS Feed
- Permalink
- Report to a Moderator
Miles,
My monitoring loop has a Wait (ms) timer in it tied to a control and I can adjust on the fly. For measurement, I use a Tick Count, a shift register and a subtract function to measure the loop period.
After some recent revisions to my code, I've gotten my monitoring loop period down below 100ms, but the updating behavior of the indicator values (and the apparent scan engine update rate) hasn't changed.
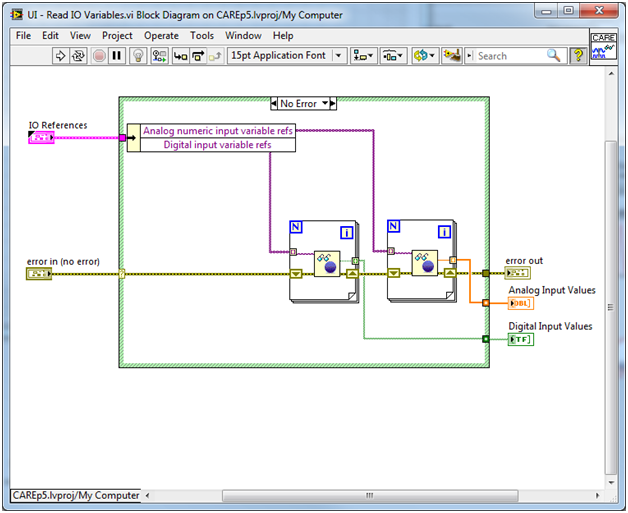
When you ask about which VI I'm "reading my variables in", do you mean the VI where I actually pull the values from the variables? The subVI below is in the monitoring loop we've been discussing in UI Main.vi.
I don't have any variable reads happening in the RSI Low Speed.vi on the cRIO. The only significant variable polling is happening on the host computer in the subVI shown above.
As I mentioned earlier, I'm fairly new to RT and cRIO programming, so let me know if this is not the best way to develop the desired behavior.
Thanks!
09-27-2013 02:29 PM
- Mark as New
- Bookmark
- Subscribe
- Mute
- Subscribe to RSS Feed
- Permalink
- Report to a Moderator
Hi Cameron,
Sorry, I was a bit unclear in my last post. What I'm primarily concerned with is how you are communicating data between your Real-Time device and your host machine. Are you using network streams, network shared variables, or some other method. How you're communicating and what your code looks like where you are performing that communication is possibly where the hold up is.
Emerson Test & Measurement Group
Senior System Support Engineer
09-27-2013 02:32 PM
- Mark as New
- Bookmark
- Subscribe
- Mute
- Subscribe to RSS Feed
- Permalink
- Report to a Moderator
No problem. I have a network stream set up for the messaging, but I'm using network shared variables for the IO variable reads, which I believe was the way the RT cRIO project template was designed initially.
09-30-2013 02:06 PM
- Mark as New
- Bookmark
- Subscribe
- Mute
- Subscribe to RSS Feed
- Permalink
- Report to a Moderator
Have you checked to see if your monitoring loop is ever executing the false case of the case structure? You could put a count in here to see if it is occasionally iterating the false case and slowing things down.
Also since you are reading from network shared variables on your host, where are you writing to them on your cRIO? If the writes are going through at regular time intervals without problems, then it may be down to the network being the limitation. You can test this by putting the same benchmarking measures you have in your Windows Monitoring loop into whatever loop you are writing to your shared variables in.
Emerson Test & Measurement Group
Senior System Support Engineer
09-30-2013 06:47 PM
- Mark as New
- Bookmark
- Subscribe
- Mute
- Subscribe to RSS Feed
- Permalink
- Report to a Moderator
I believe what you are seeing is the Scan Engine Update Rate setting under the properties of the target itself. The scan engine rate is independent of this and if you want your host to read the updates more often than 100ms you will have to change this. As noted above this will increase the CPU usage of your target and you should monitor this to find an optimal setting.
10-16-2013 01:36 PM
- Mark as New
- Bookmark
- Subscribe
- Mute
- Subscribe to RSS Feed
- Permalink
- Report to a Moderator
Thanks for the responses.
Miles, I checked to make sure that the monitoring loop wasn't occasionally using the false case of the case structure, and it is not. The true case is consistently being used.
When you ask where I am "writing to my variables on my cRIO", what exactly do you mean? I'm not sure I really understand the differences between variable types and perhaps I've caused some confusion with my terminology, but the variables I am attempting to read at a faster rate than every 800ms are input and output variables associated with modules on the cRIO. For example, a 4-20mA analog input channel (in my case, the path for one such variable is ni.var.psp://10.1.20.49/mod2/AI0). In my host PC VI, I compile all the relevant paths of the variables of interest into an array, and then use a for loop to read the variables and populate my front panel indicators. So nowhere in my RT VIs do I "write" to these variables (nor read from them), but I poll them programmatically first and only via my Host PC VI. Since I'm not "writing" to the variables on the cRIO, I'm not sure how I can benchmark the write frequency. Hopefully that makes sense.
Craig, the scan engine setting you highlighted in your post is actually the only way I know of for adjusting the update rate of my network published variables. I checked again, and the "Network Publishing Period" of the target itself is 100ms, just as you show in your image. In spite of the 100ms setting, my measured update period on these IO variables from the cRIO is roughly 800-900ms. If there is another (programmatic?) way to modify the update rate, I don't know of it, and perhaps that is my problem.
Any other ideas?
Thanks again for all the help and suggestions.


