- Subscribe to RSS Feed
- Mark Topic as New
- Mark Topic as Read
- Float this Topic for Current User
- Bookmark
- Subscribe
- Mute
- Printer Friendly Page
build graph or chart
05-27-2008 01:01 PM
- Mark as New
- Bookmark
- Subscribe
- Mute
- Subscribe to RSS Feed
- Permalink
- Report to a Moderator
05-27-2008 01:05 PM - edited 05-27-2008 01:05 PM
- Mark as New
- Bookmark
- Subscribe
- Mute
- Subscribe to RSS Feed
- Permalink
- Report to a Moderator
Message Edited by JeffOverton on 05-27-2008 02:05 PM
05-27-2008 02:51 PM
- Mark as New
- Bookmark
- Subscribe
- Mute
- Subscribe to RSS Feed
- Permalink
- Report to a Moderator
05-27-2008 03:38 PM - edited 05-27-2008 03:38 PM
- Mark as New
- Bookmark
- Subscribe
- Mute
- Subscribe to RSS Feed
- Permalink
- Report to a Moderator
Message Edited by altenbach on 05-27-2008 01:38 PM
05-27-2008 04:07 PM
- Mark as New
- Bookmark
- Subscribe
- Mute
- Subscribe to RSS Feed
- Permalink
- Report to a Moderator
altenbach
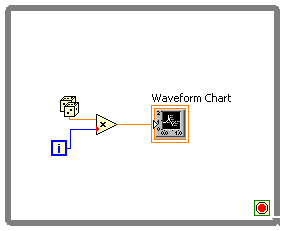
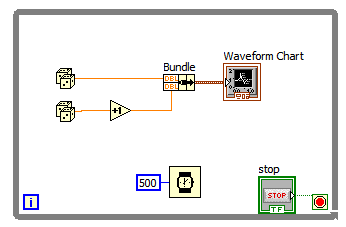
What I need to do is collect data from two sensors (temperature and pressure) and display in a graph like photo attached.
Tks
05-27-2008 04:31 PM - edited 05-27-2008 04:32 PM
- Mark as New
- Bookmark
- Subscribe
- Mute
- Subscribe to RSS Feed
- Permalink
- Report to a Moderator

Message Edited by altenbach on 05-27-2008 02:32 PM
05-28-2008 10:18 AM
- Mark as New
- Bookmark
- Subscribe
- Mute
- Subscribe to RSS Feed
- Permalink
- Report to a Moderator
05-28-2008 10:43 AM
- Mark as New
- Bookmark
- Subscribe
- Mute
- Subscribe to RSS Feed
- Permalink
- Report to a Moderator
Your graph is in the same loop as where you create the data points, so you only send two coordinates to the graph, which may be difficult to see.
Use a For Loop to generate the numeric arrays. Then wire them to the graph.
RayR
05-28-2008 10:54 AM - edited 05-28-2008 10:55 AM
- Mark as New
- Bookmark
- Subscribe
- Mute
- Subscribe to RSS Feed
- Permalink
- Report to a Moderator

Well, unless we know the sampling rate, this does not help. How many points will be on the graph in the worst case scenario? Instead of growing the history without limits (which can be very hard on memory management), you might want to use a fixed size FIFO buffer to keep only the last N point of the history.
muganga wrote:
At least 5 minutes and at most 24 hours.
Message Edited by altenbach on 05-28-2008 08:55 AM
05-28-2008 11:30 AM
- Mark as New
- Bookmark
- Subscribe
- Mute
- Subscribe to RSS Feed
- Permalink
- Report to a Moderator
thank you everybody for all....
Let me try explain what I want do.
I have two sensors, temperature and pressure. After press a button in a specific VI, both sensores start working and start registering the temperature and pressure. Independent of time. I mean, just if pressure or temperature change I will have another point plotted in the graph.
Using the while loop with time delay, both sensors are working according to time. As I told before, I dont want the sensors working with time.
What is the best way to do this?
Tks
Muganga
