- Subscribe to RSS Feed
- Mark Topic as New
- Mark Topic as Read
- Float this Topic for Current User
- Bookmark
- Subscribe
- Mute
- Printer Friendly Page
Word Set Graph VI's problem
06-09-2010 04:23 AM
- Mark as New
- Bookmark
- Subscribe
- Mute
- Subscribe to RSS Feed
- Permalink
- Report to a Moderator
Hi - Please help 😞
Im having a problem with automatic generation of graphs in Word using Labview
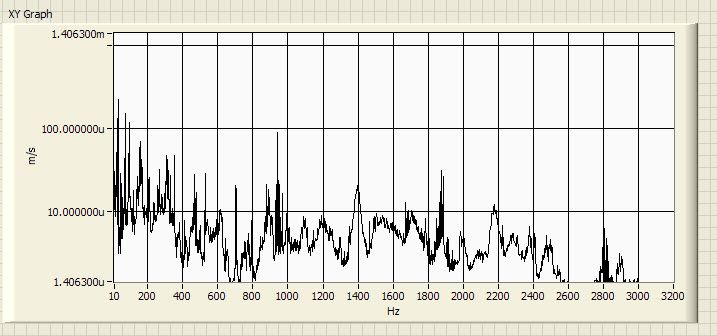
I'm trying to make a graph that look familiar with the one shown on the front panel.
That is, with a logarithmic Y scale, and with Y values represented as SI notation (%p).
For some reason, the graph is not presented as I expect, as my Y values are just shown as "%p" in the word doc. and the X scale values are shown on top of the graph (I want it to be on the bottom).
I want it, to look like this:

This is my code:
Last question: Is it not possible to show multiple curves in Word with this LV tool?
Many thanks
Ulrik
02-28-2018 05:23 AM
- Mark as New
- Bookmark
- Subscribe
- Mute
- Subscribe to RSS Feed
- Permalink
- Report to a Moderator
have you sloved your problem, how to move the x scale to bottom?


