- Subscribe to RSS Feed
- Mark Topic as New
- Mark Topic as Read
- Float this Topic for Current User
- Bookmark
- Subscribe
- Mute
- Printer Friendly Page
Waveform graph x scale
06-20-2007 02:07 PM
- Mark as New
- Bookmark
- Subscribe
- Mute
- Subscribe to RSS Feed
- Permalink
- Report to a Moderator
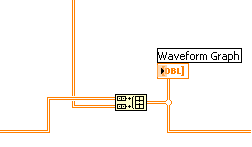
I am using a waveform graph. My x scale is the time value of data being taken.
I want the x scale to start at zero and my oldest data being displayed first.
In other words a progessive flow of how data is seen on a graph starting from when the data was first
taken to eventually newest data on the right side of the graph.
Right now the graph does the opposite with my newest data displaying first.
Please ...using a chart is NOT an option as I need cursors.
Many Thanks !!
06-20-2007 02:21 PM
- Mark as New
- Bookmark
- Subscribe
- Mute
- Subscribe to RSS Feed
- Permalink
- Report to a Moderator
@ugman wrote:
Right now the graph does the opposite with my newest data displaying first.
Are you inverting the array before sending it to the graph? or.... how do you store the values which go to the graph?
Typically, values on a graph progress in time, thus the newest value is on the right.
Can you post your vi?
06-20-2007 02:29 PM - edited 06-20-2007 02:29 PM
- Mark as New
- Bookmark
- Subscribe
- Mute
- Subscribe to RSS Feed
- Permalink
- Report to a Moderator
Message Edited by ugman on 06-20-2007 02:31 PM
06-20-2007 02:43 PM - edited 06-20-2007 02:43 PM
- Mark as New
- Bookmark
- Subscribe
- Mute
- Subscribe to RSS Feed
- Permalink
- Report to a Moderator
Message Edited by JoeLabView on 06-20-2007 03:44 PM
