- Subscribe to RSS Feed
- Mark Topic as New
- Mark Topic as Read
- Float this Topic for Current User
- Bookmark
- Subscribe
- Mute
- Printer Friendly Page
Tracking down delay
Solved!07-22-2021 03:19 PM - edited 07-22-2021 04:13 PM
- Mark as New
- Bookmark
- Subscribe
- Mute
- Subscribe to RSS Feed
- Permalink
- Report to a Moderator
Hi,
I am trying to track down a time delay on a huge project I didn't build. I added time outputs to a log on what I thought was adjacent executions. They are 4-5 seconds apart. I hypothesize that this may be due to some parallel process, but I can't actually find what it would be.
Are there any good troubleshooting techniques? I will attach a screenshot in case it's useful.
Thank you
Katie
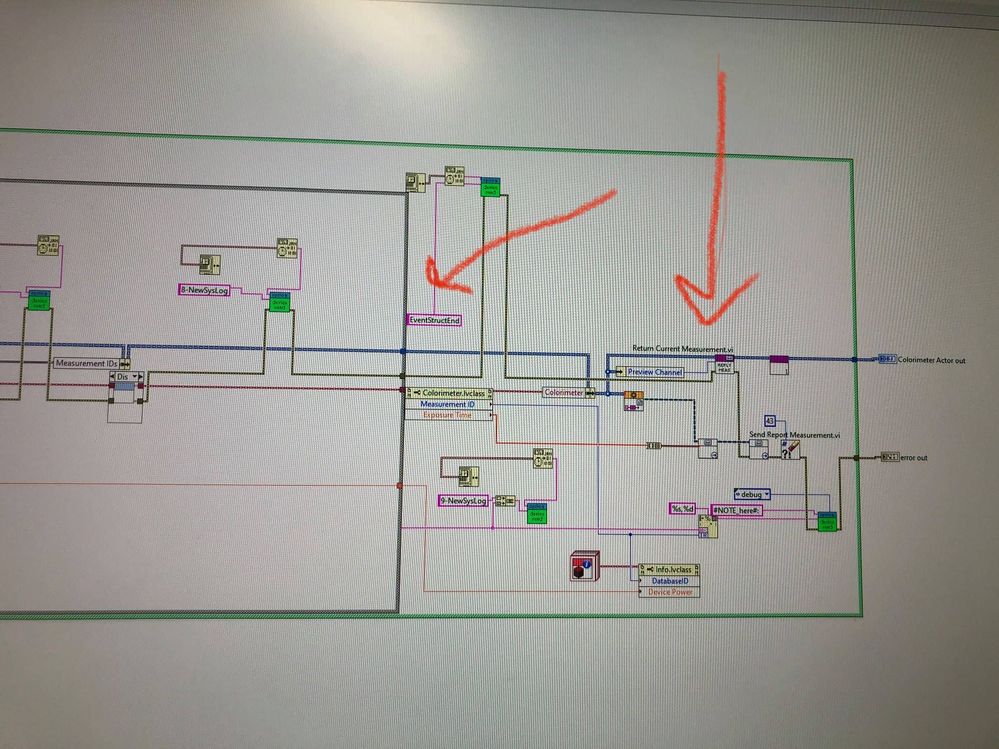
Edit: screenshots.The first is a log. The second and last are most relevant. The second has the log with the time delay, and the final has the block diagram for the vi which corresponds to the outputs. The two I pointed out with arrows are the adjacent ones.
Solved! Go to Solution.
07-22-2021 03:22 PM
- Mark as New
- Bookmark
- Subscribe
- Mute
- Subscribe to RSS Feed
- Permalink
- Report to a Moderator
Hi Katie,
@KatieFM wrote:
Are there any good troubleshooting techniques? I will attach a screenshot in case it's useful.
Yes. Yes, please.
07-22-2021 04:14 PM
- Mark as New
- Bookmark
- Subscribe
- Mute
- Subscribe to RSS Feed
- Permalink
- Report to a Moderator
Just attached them, thank you.
07-22-2021 04:31 PM - edited 07-22-2021 04:32 PM
- Mark as New
- Bookmark
- Subscribe
- Mute
- Subscribe to RSS Feed
- Permalink
- Report to a Moderator
Hello Katie,
put the evaluation of the current time-stamp inside your logging VI and not parallel to you other running code in your main VI.
THINK dataflow, currently you can not tell when all of your "Get Date/Time in seconds" are really evaluated.
Regards, Jens
07-22-2021 04:58 PM
- Mark as New
- Bookmark
- Subscribe
- Mute
- Subscribe to RSS Feed
- Permalink
- Report to a Moderator
Your timestamp queries are unconstrained by dataflow, so they're free to do their time queries *immediately*. Then those "start time" values may not be written into your log file for a while because the logging functions generally *are* constrained by dataflow along the error wire.
Apparently it takes several actual seconds to run through your series of functions (mostly) sequentially.
"EventStructEnd" is indeed logged after the case structure finishes execution, but the timestamp it's tagged with was probably grabbed before the case structure started execution.
Dunno what you used to create the first timestamp in your log file, but that one *seems* like it might be telling the truth about when the logging itself happened. At least it shows time moving forward whereas your 2nd timestamp (with the dataflow issues I've explained) seems to indicate that you've invented time travel.
Since it seems you're always feeding that same timestamp string into the logging function, you could fix things pretty easily by doing the timestamp query *inside* that function each time it's called.
-Kevin P


