- Subscribe to RSS Feed
- Mark Topic as New
- Mark Topic as Read
- Float this Topic for Current User
- Bookmark
- Subscribe
- Mute
- Printer Friendly Page
Remove the zoom of chart programmatically
03-21-2024 11:08 AM - edited 03-21-2024 11:28 AM
- Mark as New
- Bookmark
- Subscribe
- Mute
- Subscribe to RSS Feed
- Permalink
- Report to a Moderator
Hello
I have some data that is being plotted in charts, and I need to save the image of that chart to add it to a report
But if I zoom in before saving, the image saved with the zoom applied, I would like that when the image is saved, it will be saved without any zoom, with the "original" graphic
Is there any way to programmatically make the chart unzoomed and placed on initial point of the graph?
03-21-2024 11:24 AM
- Mark as New
- Bookmark
- Subscribe
- Mute
- Subscribe to RSS Feed
- Permalink
- Report to a Moderator
Option 1:
Pass all your data into 2 charts, one off-screen and one on-screen. When it's time to save the image, save it from the offscreen one.
Option 2:
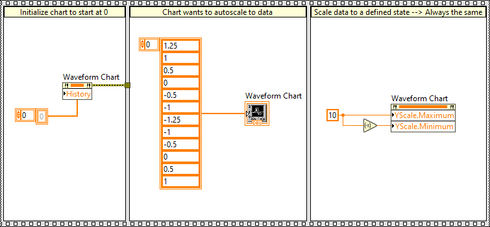
Create a property node for the chart, and manually set the X scale and Y scale Range.Maximum and Range.Minimum properties to be the min/max extents of the data displayed in the chart.
03-21-2024 11:44 AM - edited 03-21-2024 11:44 AM
- Mark as New
- Bookmark
- Subscribe
- Mute
- Subscribe to RSS Feed
- Permalink
- Report to a Moderator
Create a property node for the graph. The property you are looking for is Palette->Active Tool. Set that value to 5.

There are only two ways to tell somebody thanks: Kudos and Marked Solutions
Unofficial Forum Rules and Guidelines
"Not that we are sufficient in ourselves to claim anything as coming from us, but our sufficiency is from God" - 2 Corinthians 3:5
03-21-2024 12:14 PM - edited 03-21-2024 12:14 PM
- Mark as New
- Bookmark
- Subscribe
- Mute
- Subscribe to RSS Feed
- Permalink
- Report to a Moderator
How can i use it for another and different graphs?
03-21-2024 01:25 PM
- Mark as New
- Bookmark
- Subscribe
- Mute
- Subscribe to RSS Feed
- Permalink
- Report to a Moderator
To ensure the same look for all data, set the property nodes to create the same look.
If it helped - KUDOS
If it answers the issue - SOLUTION
03-21-2024 01:58 PM - edited 03-21-2024 01:58 PM
- Mark as New
- Bookmark
- Subscribe
- Mute
- Subscribe to RSS Feed
- Permalink
- Report to a Moderator
@leandrofeder wrote:
How can i use it for another and different graphs?
Wire up a reference to the Property Node and you can use the same node for any graph.

There are only two ways to tell somebody thanks: Kudos and Marked Solutions
Unofficial Forum Rules and Guidelines
"Not that we are sufficient in ourselves to claim anything as coming from us, but our sufficiency is from God" - 2 Corinthians 3:5

