Turn on suggestions
Auto-suggest helps you quickly narrow down your search results by suggesting possible matches as you type.
Showing results for
Topic Options
- Subscribe to RSS Feed
- Mark Topic as New
- Mark Topic as Read
- Float this Topic for Current User
- Bookmark
- Subscribe
- Mute
- Printer Friendly Page
Reading X Y data into a graph from file
Member
11-08-2006 08:25 AM
Options
- Mark as New
- Bookmark
- Subscribe
- Mute
- Subscribe to RSS Feed
- Permalink
- Report to a Moderator
My data looks like this - (which is in a plain ascii text file)
345
1003
347
1005
351
1013
.....
....
where the x and y occur alternately.
How would one display this data in an XY Graph.
Many thanks,
Ben H
345
1003
347
1005
351
1013
.....
....
where the x and y occur alternately.
How would one display this data in an XY Graph.
Many thanks,
Ben H
Knight of NI
11-08-2006 09:13 AM - edited 11-08-2006 09:13 AM
Options
- Mark as New
- Bookmark
- Subscribe
- Mute
- Subscribe to RSS Feed
- Permalink
- Report to a Moderator
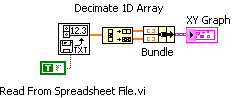
That's simple. Use the Read From Spreadsheet to get the column and then the decimate function to get every other element into two different arrays. Bundle them together and you are done.
Message Edited by Dennis Knutson on 11-08-2006 08:13 AM
11-08-2006 09:26 AM
Options
- Mark as New
- Bookmark
- Subscribe
- Mute
- Subscribe to RSS Feed
- Permalink
- Report to a Moderator
Thanks Dennis.....works perfect!
Cheers, Ben
Cheers, Ben
