- Subscribe to RSS Feed
- Mark Topic as New
- Mark Topic as Read
- Float this Topic for Current User
- Bookmark
- Subscribe
- Mute
- Printer Friendly Page
Profiling for excessive UI updates?. (Profile shows 'Display' times of 0.0 for all VI's, and UI is jittery)
11-04-2018 01:11 PM
- Mark as New
- Bookmark
- Subscribe
- Mute
- Subscribe to RSS Feed
- Permalink
- Report to a Moderator
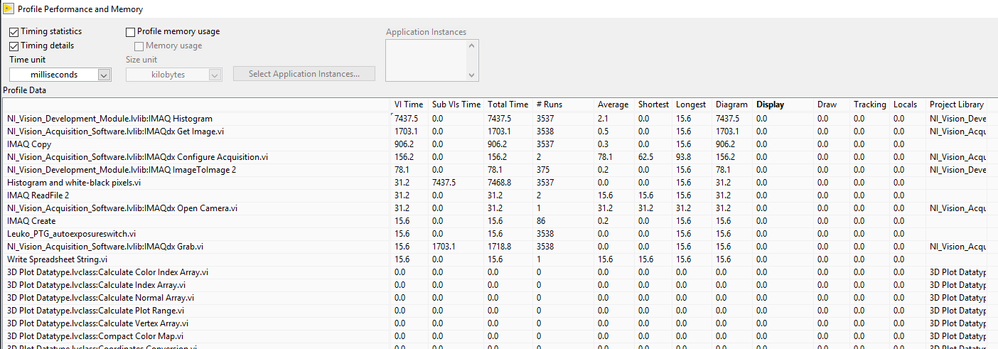
I'm trying to identify excessive/unnecessary UI updates in a complex (chaotic) VI, but the profiler is showing 'Display' to be 0.0 ms for all VIs.
I seem to recall a debug mode where you can highlight updates on the front panel. i.e. flash them red every time they're updated.. or did I dream of that??
Any such approaches? or a way to make profiler show accurate 'Display' results?
Thanks,
Ian
Labview 2017 sp3
- Tags:
- UI profiler
11-04-2018 01:21 PM
- Mark as New
- Bookmark
- Subscribe
- Mute
- Subscribe to RSS Feed
- Permalink
- Report to a Moderator
Can you show a screenshot of the profiler so we know which field you are looking at?
Front panel updates are asynchronous and run in the UI thread, so even if you write thousands of updates in a millisecond to an indicator all you do is update the transfer buffer, the indicator only gets updated occasionally (tuned to the max speed of your eyes).
Some indicators can get expensive to update (e.g. an xy graph with millions of points). Front panel updates also get more expensive if you have overlapping controls.
I am not familiar with the term "Chaotic" as it applies to code. What is the loop rate? Do you have performance problems? What does the program do?
11-04-2018 01:33 PM
- Mark as New
- Bookmark
- Subscribe
- Mute
- Subscribe to RSS Feed
- Permalink
- Report to a Moderator
The field I'm looking at is the 'Display' field shown below. Every value is 0.0 ms (0 ns).
The VI sends data points to various charts, and an image to a imaq image control at about 60 data points per second (validated through loop timers), with the UI updating at only about 5 times per second.
The CPU load (across 4 cores) is stable at around 20%
GPU runs at about 2%
I've checked for overlapping controls and there aren't any (maybe some label boxes overlapping slightly, does that count??)
I can't figure out why the UI update rate is so low.
11-04-2018 01:56 PM
- Mark as New
- Bookmark
- Subscribe
- Mute
- Subscribe to RSS Feed
- Permalink
- Report to a Moderator
I just tried reducing the size of the IMAQ image control and UI refresh rates went up drastically.
Is the IMAQ image control the fastest way to display an IMAQ image? I don't need any UI interactions with the image, just a display.
11-04-2018 01:58 PM
- Mark as New
- Bookmark
- Subscribe
- Mute
- Subscribe to RSS Feed
- Permalink
- Report to a Moderator
Or another question is, is there a way to speed up an IMAQ image control? Removing certain interaction options, perhaps?
11-04-2018 02:49 PM
- Mark as New
- Bookmark
- Subscribe
- Mute
- Subscribe to RSS Feed
- Permalink
- Report to a Moderator
Sorry, I don't have IMAQ here. Why is it a "control" instead of an "indicator"?
How often does the image change? Are you trying to do some kind of movie display? How do you update it?
11-04-2018 05:09 PM
- Mark as New
- Bookmark
- Subscribe
- Mute
- Subscribe to RSS Feed
- Permalink
- Report to a Moderator
You're right, I mean Indicator rather than control.
The system is grabbing images from a camera and displaying them on screen, while doing some image analysis.
Two loops:
- image capture (2000x1000 pixel image) (60 loops per second)
- Image tiling (to a 18000 x 12000 pixel image), analysis and display (5 loops per second)
It seems the slow down stems from the image display in the IMAQ Image indicator, depending on the size of the indicator. If it's small, the UI refreshes closer to 60 FPS, if it's large it's ~5 FPS.
The reason I started looking into this is the program used to run well with the IMAQ image indicator large, but after not being run for a few months, and the computer being updated (windows, labview service packs) I saw a degradation in performance. I suspect something in the way the computer is handling UI updates has changed, but I can't figure it out.
11-04-2018 06:45 PM
- Mark as New
- Bookmark
- Subscribe
- Mute
- Subscribe to RSS Feed
- Permalink
- Report to a Moderator
The tiled image is several hundred MB to almost a GB depending on type. (8bit grey, rgb color, etc.). This will not be cheap. Since there are no commercial monitors that can display all these pixels anyway, why are you pumping such huge amounts to the UI?
11-04-2018 07:07 PM
- Mark as New
- Bookmark
- Subscribe
- Mute
- Subscribe to RSS Feed
- Permalink
- Report to a Moderator
That's a fair question.
I generate that image in memory for saving as an image. It is helpful to be able to zoom into the image, but tbh, the preview version could definitely be a down-sampled version of the larger image.
I guess that's a healthy way forward. It's just odd that it used to work flawlessly, with no changes to labview code.
I think it's best to just move on and close the case.
Thanks for the tips

