Turn on suggestions
Auto-suggest helps you quickly narrow down your search results by suggesting possible matches as you type.
Showing results for
Topic Options
- Subscribe to RSS Feed
- Mark Topic as New
- Mark Topic as Read
- Float this Topic for Current User
- Bookmark
- Subscribe
- Mute
- Printer Friendly Page
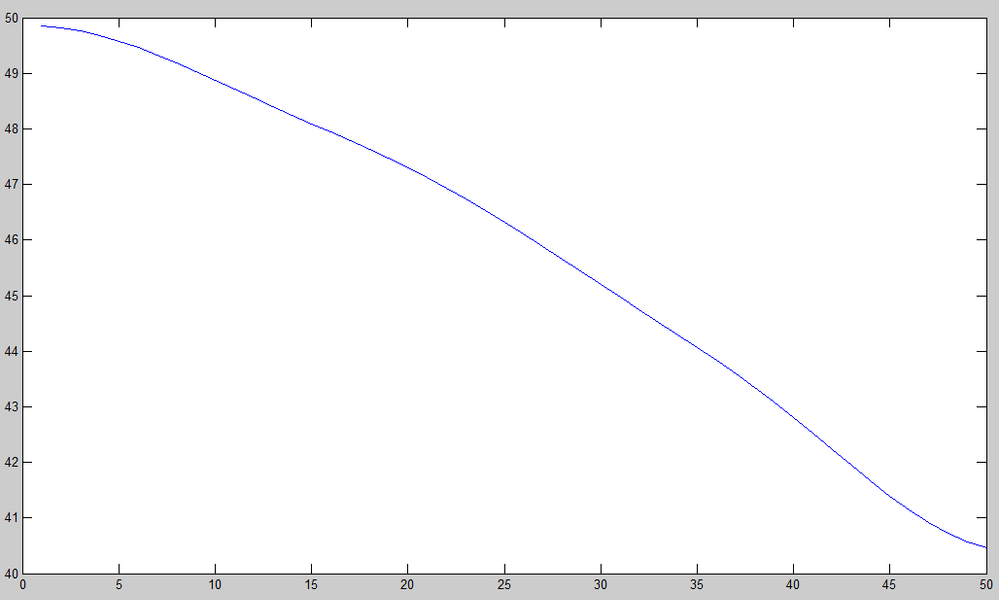
Polynomial plotting of my original curve
Member
12-10-2009 02:07 AM
Options
- Mark as New
- Bookmark
- Subscribe
- Mute
- Subscribe to RSS Feed
- Permalink
- Report to a Moderator
Hi
I am trying to re-plot my original curve with a best fitting curve. I am using a 3rd order polynomial to do this. However, the output of the fitting is in numeric and not a graph. I could not identify which part of my VI is giving the problem. Therefore, do i use the coefficient to re-plot my graph or using the best polynomial fit is enough to plot together with my original curve.
My intention is that the next step i will subtract the value of the re-plot curve with the original curve.
I am using LabView 8.6.1
Thank you for helping out
Cheers

Trusted Enthusiast
12-10-2009 06:06 AM
Options
- Mark as New
- Bookmark
- Subscribe
- Mute
- Subscribe to RSS Feed
- Permalink
- Report to a Moderator
The Curve Fitting express vi will output dynamic data. Otherwise use the convert to dynamic data signal
Greetings from Germany
Henrik
LV since v3.1
“ground” is a convenient fantasy
'˙˙˙˙uıɐƃɐ lɐıp puɐ °06 ǝuoɥd ɹnoʎ uɹnʇ ǝsɐǝld 'ʎɹɐuıƃɐɯı sı pǝlɐıp ǝʌɐɥ noʎ ɹǝqɯnu ǝɥʇ'
Henrik
LV since v3.1
“ground” is a convenient fantasy
'˙˙˙˙uıɐƃɐ lɐıp puɐ °06 ǝuoɥd ɹnoʎ uɹnʇ ǝsɐǝld 'ʎɹɐuıƃɐɯı sı pǝlɐıp ǝʌɐɥ noʎ ɹǝqɯnu ǝɥʇ'

