- Subscribe to RSS Feed
- Mark Topic as New
- Mark Topic as Read
- Float this Topic for Current User
- Bookmark
- Subscribe
- Mute
- Printer Friendly Page
Multiplot waveforms
Solved!05-05-2022 10:37 AM - edited 05-05-2022 10:39 AM
- Mark as New
- Bookmark
- Subscribe
- Mute
- Subscribe to RSS Feed
- Permalink
- Report to a Moderator
Hello Labview community i'im asking about the following issue :
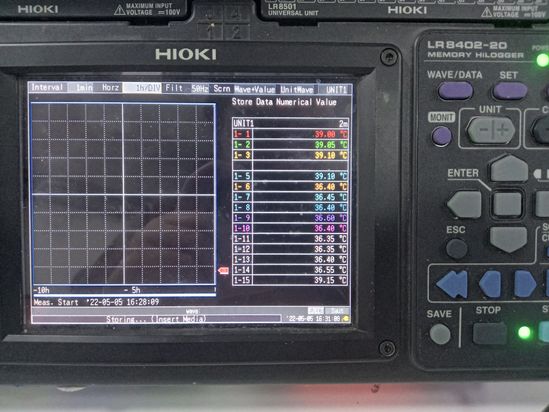
every 1min i acquire 15 diifferent values from 15 different channel. the next 1min i have other values and the process is repeated until i press the hioki stop button. i want to plot each channel in my wave form graph ie i want to have 15 plots in my waveform graph . Can i plot these values point by point or i should provide 15 different arrays for each plot ?
Thank you
Solved! Go to Solution.
05-05-2022 12:54 PM - edited 05-05-2022 12:59 PM
- Mark as New
- Bookmark
- Subscribe
- Mute
- Subscribe to RSS Feed
- Permalink
- Report to a Moderator
Sorry, I cannot open your VI (only have LabVIEW 2020 here), but you probably should first fix some glaring errors: (consider "save for previous")
- Race condition doe to blatant overuse of local variables.
- Sequence structure that serves no purpose. Just delete it! If you want the FOR loop to start after the wait, just wire the output of the wait to the edge of the FOR loop to create a data dependency. If the wait is longer than fractions of a second, consider a state machine instead to keep the VI responsive to other inputs.
- Maybe you want a chart instead?
- If you would build the array inside the loop, you would not need to transpose later.
- Index array is resizeable.
- You seem to discard most of the data. (you get a 2D array with 30 elements, and all you keeps is two elements!)
As a first step, eliminate all hardware IO and just simulate typical data until the graphing is worked out.
05-05-2022 12:57 PM
- Mark as New
- Bookmark
- Subscribe
- Mute
- Subscribe to RSS Feed
- Permalink
- Report to a Moderator
Hi Jasmin,
@JASMIN185 wrote:
i want to plot each channel in my wave form graph ie i want to have 15 plots in my waveform graph . Can i plot these values point by point or i should provide 15 different arrays for each plot ?
Did you look at the context help of your waveform graph? It shows which datatype to connect to show an array of plots!
Why do you use all those IndexArray functions?
Why do you build an array of exactly two samples to show them on your graph? Don't you want 15 plots?
Wire the 2D array directly to the graph!
(Unfortunately you attached a LV2021 VI, which I cannot open. Next time you should consider posting a downconverted version of your VI, say LV2019 or LV2017. See File menu->save for previous…)
05-05-2022 01:39 PM
- Mark as New
- Bookmark
- Subscribe
- Mute
- Subscribe to RSS Feed
- Permalink
- Report to a Moderator
Here's one simple possibility using a chart. Maybe you can adapt if to your needs.
05-06-2022 10:17 AM
- Mark as New
- Bookmark
- Subscribe
- Mute
- Subscribe to RSS Feed
- Permalink
- Report to a Moderator
thank youu so much it works well


