- Subscribe to RSS Feed
- Mark Topic as New
- Mark Topic as Read
- Float this Topic for Current User
- Bookmark
- Subscribe
- Mute
- Printer Friendly Page
LVOOP memory monitor?
06-04-2014 11:17 AM
- Mark as New
- Bookmark
- Subscribe
- Mute
- Subscribe to RSS Feed
- Permalink
- Report to a Moderator
So, lately I have been trying to profile the memory usage of my program. I can use the Profile -> Performance and Memory and it gives me an idea of what some of the VI's are doing... but honestly It doesn't answer any of the questions i have for LVOOP. Also if someone has a good link on how the Performance and Memory should be used. I just feel like I don't get any relevant information from it.
I am curious if there is a way to:
Tell how many instances of class N are currently in memory.
How much memory is currently allocated to Instance M of class N
View/Probe private data of this class
I feel like there should be some way to monitor this information, or maybe that's just wishful thinking.
06-04-2014 01:00 PM
- Mark as New
- Bookmark
- Subscribe
- Mute
- Subscribe to RSS Feed
- Permalink
- Report to a Moderator
Yes, at least wishful thinking. You see since LV is a dataflow language, asking how many objects of class N there are is sort of like asking how many floating-point values there are in the program. Yes they exist in buffers but those are being created and destroyed all the time, so I'm not sure it would be possible to get anything approaching a reliable number.
Mike...
Certified Professional Instructor
Certified LabVIEW Architect
LabVIEW Champion
"... after all, He's not a tame lion..."
For help with grief and grieving.
06-04-2014 01:23 PM
- Mark as New
- Bookmark
- Subscribe
- Mute
- Subscribe to RSS Feed
- Permalink
- Report to a Moderator
Alright, so I'm a wishful thinker.
But just to clarify.
========================================
LVOOP w/out DVR is what your talking about.
LVOOP w/ DVR should only be allocated once right?
========================================
So, some other things. If i have an object that is fairly large labview will make like Bunches of copies, hapazardly reading and writing to memory... ? Should I switch large objects to LVOOP + DVR then?
Also what tools do i have at my dispoal to figurout what my program is doing with its memory? It runs fine for 20 hrs or so but then pagefiles + slowness.
06-04-2014 01:37 PM - edited 06-04-2014 01:42 PM
- Mark as New
- Bookmark
- Subscribe
- Mute
- Subscribe to RSS Feed
- Permalink
- Report to a Moderator
@Taylor_H. wrote:
So, lately I have been trying to profile the memory usage of my program. I can use the Profile -> Performance and Memory and it gives me an idea of what some of the VI's are doing... but honestly It doesn't answer any of the questions i have for LVOOP. Also if someone has a good link on how the Performance and Memory should be used. I just feel like I don't get any relevant information from it.
I am curious if there is a way to:
Tell how many instances of class N are currently in memory.
How much memory is currently allocated to Instance M of class N
View/Probe private data of this class
I feel like there should be some way to monitor this information, or maybe that's just wishful thinking.
Lets try them in reverse order:
View/Probe private data of this class: Go ahead and Browse the examples for "Custom Probes with LabVIEW Classes.lvproj"
Open Custom Probes.vi. That Should answer how to probe any selected private data of any instance of any class. Finding the instance is manual of course.
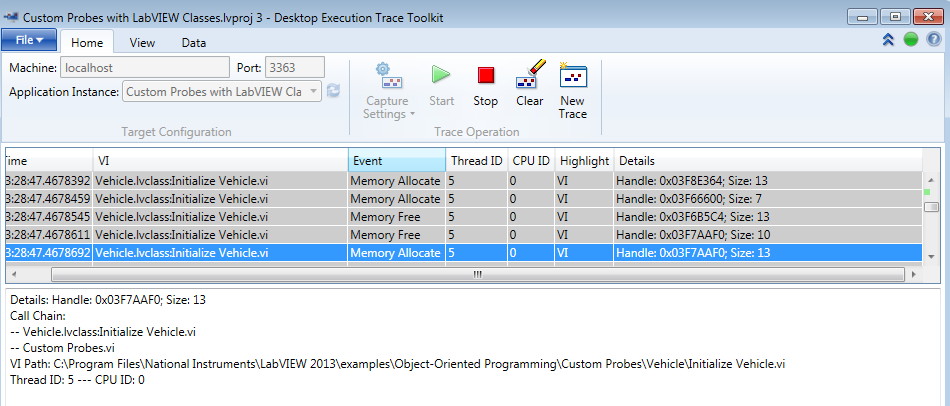
How much memory is currently allocated to Instance M of class N: You need the DETT to monitor dynamic performance but you CAN configure it to trace memory allocations deallocations and resizes. Again figureing out Class N is easy but Instance M involves some investigative work. Breakpoints and all those other debug tools can help but it is not automatic. Yet there IS enough information to find "N"
This snip was taken tracing only vi calls and memeory allocation / dealloc for a single run of "Custom Probes.vi on Custom Probes with labVIEW Classes.lvproj/MyComputer":
Tell how many instances of class N are currently in memory:
Well the DETT does provide the information. The Question really becomes "Can you count that high ordo you need to pause the app instance save the capture and parse the file with a new tool?"
DETT does ship with Developer Suite and is available as an addon for LabVIEW. So it may or may not be "Wishful thinking"
"Should be" isn't "Is" -Jay

