- Subscribe to RSS Feed
- Mark Topic as New
- Mark Topic as Read
- Float this Topic for Current User
- Bookmark
- Subscribe
- Mute
- Printer Friendly Page
How to take a graph value average based on the waveform window timestamp
01-26-2022 07:23 AM
- Mark as New
- Bookmark
- Subscribe
- Mute
- Subscribe to RSS Feed
- Permalink
- Report to a Moderator
Hi all, I have a lengthy VI that I am doing some data analysis on.
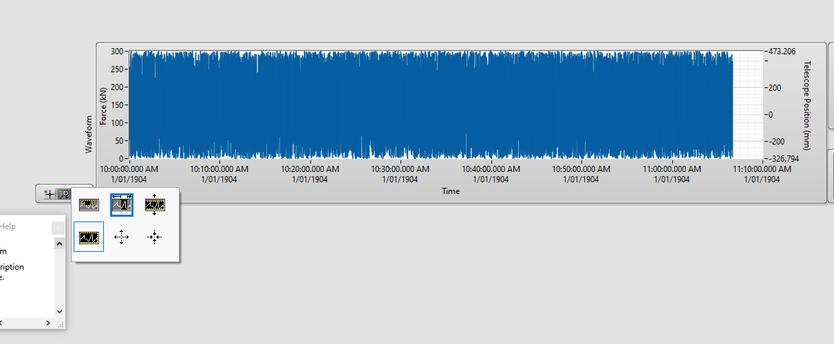
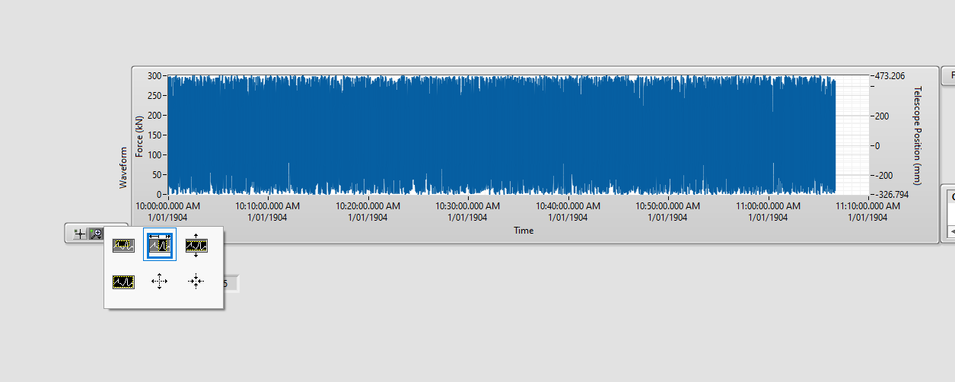
I have a waveform graph in which I plot multiple lines. I am wanting to take an average of one of the graph lines based on the window timestamp selected. For example, looking at the graph below, I would want to take an average of one of the lines (dark blue) based on the time of the window (duration of the window is 5 minutes 2 seconds, I have an indiator for this.)
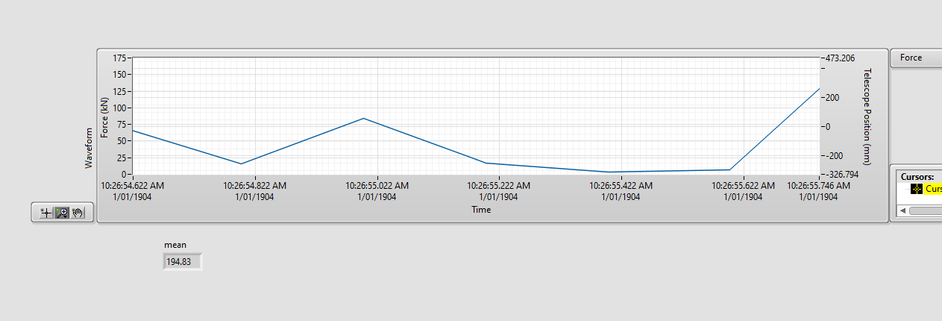
Then, if I zoom into the window, like the image below, I would want to take the average of the dark blue line based on the window of the new zoomed in graph (in the instance it would be 13 seconds worth).
I unfortunately cannot copy the VI here, but what would be the best method? I have tried using the mean VI by taking the property node of the window, using the start time as the mean VI's starting time of the window and the duration of the window but I dont get the right results
Thanks heaps
01-26-2022 09:26 AM
- Mark as New
- Bookmark
- Subscribe
- Mute
- Subscribe to RSS Feed
- Permalink
- Report to a Moderator
If you can't attach your VI so we can see what you are doing, then my advice is for you to write a simple VI that generates, say, 30 seconds of 4-channel random data, plots it on an Indicator similar to the one you are using, and attach that (much simpler) VI, framing your question in terms of a VI that we can look at and "play with". Without knowing what you are doing and something about how you are doing it, it is difficult to provide meaningful help.
Bob Schor
01-26-2022 05:14 PM
- Mark as New
- Bookmark
- Subscribe
- Mute
- Subscribe to RSS Feed
- Permalink
- Report to a Moderator
Hi Bob
Please see attached test VI. The sequenxe is, use the 'Zoom Out' function and view the mean.
Select a 'Zoomed In' section of the graph
You can see at this point, the mean should not be what is being indicated. Please see attached VI
01-26-2022 05:38 PM
- Mark as New
- Bookmark
- Subscribe
- Mute
- Subscribe to RSS Feed
- Permalink
- Report to a Moderator
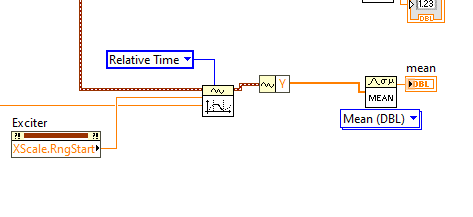
Mean.vi has two input modes, samples and relative time. It defaults to samples, and IIRC those property nodes return time. Change your input mode to Relative time and see if that helps. I'd suggest putting some indicators on your XScale.RngStart and Min/Max values, as well as the array you're feeding into Mean.vi to make sure you're extracting the points you think you are.
I think you want to use XScale.Minimum as your start time as well. Mean.vi's "Open interval?" input defaults to True, which is Open, meaning it might not grab all of the points you think it does when you're very zoomed in.
01-26-2022 07:45 PM
- Mark as New
- Bookmark
- Subscribe
- Mute
- Subscribe to RSS Feed
- Permalink
- Report to a Moderator
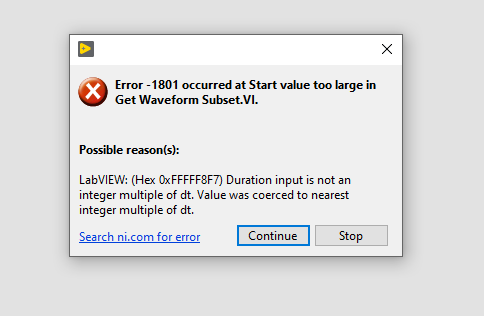
Thanks for the reply. I used relative time instead and set the flag to False, but run into this error now
Let me know your thoughts. Thanks heaps
01-27-2022 01:21 AM
- Mark as New
- Bookmark
- Subscribe
- Mute
- Subscribe to RSS Feed
- Permalink
- Report to a Moderator
Hi all
I have updated the VI with the data I am having issues with. I think it has to with my time stamp from my scale not being read correctly. The values I ready from the minimum and maximum are around 3e9 .
Thanks heaps


