- Subscribe to RSS Feed
- Mark Topic as New
- Mark Topic as Read
- Float this Topic for Current User
- Bookmark
- Subscribe
- Mute
- Printer Friendly Page
Frequency measurement
07-23-2018 09:24 AM
- Mark as New
- Bookmark
- Subscribe
- Mute
- Subscribe to RSS Feed
- Permalink
- Report to a Moderator
Hello,
I am trying to measure the frequency of an input square wave signal using "Tone Measurement VI". The frequency measurement is correct and I can only see a output graph using "waveform chart". However, I need a graph where x-axis is the time and y-axis is the measured frequency.
I have tried various ways to do but couldnt get x-axis working. The sampling rate is 50kHz so i would like to see x-axis increasing from 0 with ms intervals.
I will then need to perform a FFT on this signal but I am stuck on how could I get this time vs measured freq waveform.
I have attached the VI I am working on so hopefully it is clear.
Many thanks,
Yang
07-23-2018 09:41 AM
- Mark as New
- Bookmark
- Subscribe
- Mute
- Subscribe to RSS Feed
- Permalink
- Report to a Moderator
Hi Souken,
so you want to display frequency over time? Plot the waveform on your chart and enable time formatting of the x axis:
The problem here is some overuse of ExpressVIs and DDT wires: both hide elementary information from the programmer - in the end you don't gain from using them a lot.
07-23-2018 10:15 AM
- Mark as New
- Bookmark
- Subscribe
- Mute
- Subscribe to RSS Feed
- Permalink
- Report to a Moderator
Hi GerdW,
The fisrt graph i want is time vs measured frequency. I expect this "time" is in milliseconds starting from zero rather than HH:MM:SS format.
The second graph is the FFT results based on the results from the previous step. However, this FFT cannot be plotted at the moment and I suspect the time axis isnt correct.
I have tidied up the VI and attached.
Thanks,
07-23-2018 10:45 AM
- Mark as New
- Bookmark
- Subscribe
- Mute
- Subscribe to RSS Feed
- Permalink
- Report to a Moderator
Hi Souken,
I expect this "time" is in milliseconds starting from zero rather than HH:MM![]() S format.
S format.
Then you need to format the x axis to float numbers - and adapt the x axis scaling (multiplier) to match your sampling rate (or better: loop iteration rate).
However, this FFT cannot be plotted at the moment and I suspect the time axis isnt correct.
The whole FFT is wrong right now: why do you try to apply a FFT an the ToneMeasurement result?
Why not take the FFT from your simulated signal?
(THINK DATAFLOW!)
07-23-2018 10:59 AM
- Mark as New
- Bookmark
- Subscribe
- Mute
- Subscribe to RSS Feed
- Permalink
- Report to a Moderator
07-23-2018 10:45 AM
Hi GerdW,
Thanks for the first one. I will work on that to see how should I convert it to the milliseconds.
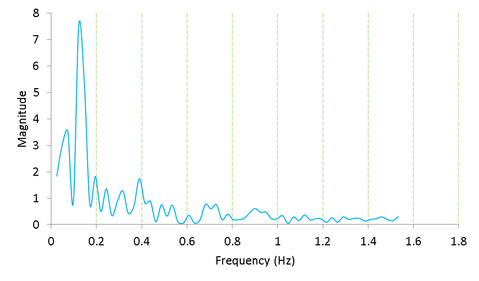
The second one is a bit tricky. The concept is to find out the frequency variation over time. e.g. frequency variation over 120 seconds. I should then be able to plot this variation in time domain. Since this frequency variation is caused by a capacitance sensor, I would like to see at which frequency the capacitance changes the most. Here are two plots I have from manual plotting using excel but i would like those to be automatically plotted by LabView.


The figure on the right is what I am after but I have to get the one on the left in order to perform FFT.
I am thinking to rebuild a waveform using measured frequency as y-axis but struggling on what should I use for x-axis (I know this can be achieved using the timestamp, but again, i want to see either second or millisecond).
Many thanks,
07-24-2018 12:41 AM - edited 07-24-2018 12:42 AM
- Mark as New
- Bookmark
- Subscribe
- Mute
- Subscribe to RSS Feed
- Permalink
- Report to a Moderator
Hi Souken,
The figure on the right is what I am after but I have to get the one on the left in order to perform FFT.
Right now you calculate the main frequency using ToneMeasurement. You need to collect the tone result in an array (or waveform) and apply the FFT on that collected array. Right now you apply a FFT on only one sample delivered from ToneMeasurement: which kind of result do you expect from an FFT working with just one sample?
Again: NOT using ExpressVIs and DDT wires will make your life (a lot!) easier. You will learn basic LabVIEW concepts as collecting data in arrays, storing data in shift registers, differences of arrays and waveforms…
07-24-2018 12:47 PM
- Mark as New
- Bookmark
- Subscribe
- Mute
- Subscribe to RSS Feed
- Permalink
- Report to a Moderator
Hi GerdW,
Many thanks pointing out.
I have now received a Frequency vs time graph and exported to .txt file. I have also spaced them to be 0.05 sec along x-axis.
I now try to implement a FFT on this signal and unfortunately i have received no value...This time, I have used the very basic FFT block but no luck.
Any advice?
Many thanks,
07-24-2018 09:50 PM
- Mark as New
- Bookmark
- Subscribe
- Mute
- Subscribe to RSS Feed
- Permalink
- Report to a Moderator


