- Subscribe to RSS Feed
- Mark Topic as New
- Mark Topic as Read
- Float this Topic for Current User
- Bookmark
- Subscribe
- Mute
- Printer Friendly Page
Excel File Conversion thru LabVIEW
01-18-2007 09:17 AM - edited 01-18-2007 09:17 AM
- Mark as New
- Bookmark
- Subscribe
- Mute
- Subscribe to RSS Feed
- Permalink
- Report to a Moderator
Message Edited by Steve.Briggs on 01-18-2007 10:21 AM
01-18-2007 10:22 AM - edited 01-18-2007 10:22 AM
- Mark as New
- Bookmark
- Subscribe
- Mute
- Subscribe to RSS Feed
- Permalink
- Report to a Moderator
Message Edited by Kenny K on 01-18-2007 10:23 AM
01-18-2007 10:23 AM - edited 01-18-2007 10:23 AM
- Mark as New
- Bookmark
- Subscribe
- Mute
- Subscribe to RSS Feed
- Permalink
- Report to a Moderator
The attached will read the file and apply the scaling to columns 2 through x and then replace them in the original array. It just uses the Array subset and the Replace Array Subset. You didn't say if you wanted to combine columns 2 through x in some manner (i.e. take the mean) and have a single column. Also, I didn't do anything with the header. You would want to read that in as characters and then rewrite that out. this should get you started though.
Message Edited by Dennis Knutson on 01-18-2007 09:23 AM
01-18-2007 11:02 AM
- Mark as New
- Bookmark
- Subscribe
- Mute
- Subscribe to RSS Feed
- Permalink
- Report to a Moderator
01-18-2007 12:20 PM - edited 01-18-2007 12:20 PM
- Mark as New
- Bookmark
- Subscribe
- Mute
- Subscribe to RSS Feed
- Permalink
- Report to a Moderator
@Dennis Knutson wrote:
You didn't say if you wanted to combine columns 2 through x in some manner (i.e. take the mean) and have a single column.
Message Edited by Steve.Briggs on 01-18-2007 01:21 PM
01-18-2007 01:03 PM
- Mark as New
- Bookmark
- Subscribe
- Mute
- Subscribe to RSS Feed
- Permalink
- Report to a Moderator
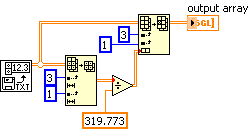
What exactly are you trying to plot because what you have doesn't make much sense to me. You've done the scaling and then the replacement but then you have two Index Array functions that get the exact same data from the 2D array. All that you are doing is extracting row 0 and because the first line in the file is text, it's all zeroes. What do you really want as the x and y axis. Also, with a file with multiple columns, how do you want that graphed versus a file with only the two columns.
Also, you cannot use a local variable for 'output array'. The way you've done it, you are guaranteed what s called a race condition. The local variable will be input to the index array function before the output array indicator will be updated.
01-18-2007 01:16 PM
- Mark as New
- Bookmark
- Subscribe
- Mute
- Subscribe to RSS Feed
- Permalink
- Report to a Moderator
@Dennis Knutson wrote:
Also, with a file with multiple columns, how do you want that graphed versus a file with only the two columns.
01-18-2007 01:32 PM
- Mark as New
- Bookmark
- Subscribe
- Mute
- Subscribe to RSS Feed
- Permalink
- Report to a Moderator
