- Subscribe to RSS Feed
- Mark Topic as New
- Mark Topic as Read
- Float this Topic for Current User
- Bookmark
- Subscribe
- Mute
- Printer Friendly Page
Data acquisition rate in data log not as specified
06-04-2019 05:48 PM
- Mark as New
- Bookmark
- Subscribe
- Mute
- Subscribe to RSS Feed
- Permalink
- Report to a Moderator
Hi I am having trouble figuring why data is not being logged at the rate I specified. Can someone please assist? I have attached the vi. I want to see the data logged at 1K, meaning 0.001 increments should be from one point to the next. Instead i get a 0.01 increments with 10 points in between. If this is not the right way to do it, how should I. Thank you for help and I apologize if similar posts already present.
06-04-2019 09:00 PM
- Mark as New
- Bookmark
- Subscribe
- Mute
- Subscribe to RSS Feed
- Permalink
- Report to a Moderator
Hi,
Firstly, thank you for attaching the VI - that makes it much easier to get started.
Secondly, a quick question: Does the XY Graph 2 display the time resolution you expect?
Thirdly, a suggestion: Try the following:
- Before your loop, create a set of time values (0 to e.g. 0.499) using a For loop, the "i" terminal, and a multiplication.
- Pass this array of doubles into your While loop, on a Shift Register. Use this value (from the SR) as your time for the samples
- Inside the While loop, add 0.5 to the array each time (after you use it in that iteration) and pass back to the outgoing Shift Register.
- Modify the Read node to read 1 Ch N Samples, and set Number of Samples to 500 (in this example, you might prefer to modify this example to e.g. 100 values and then your iteration speed is 0.1 seconds per iteration)
This will reduce the necessary loop speed (1ms is fast for a Windows PC) and improve the chance of reliable, continuous data.
06-05-2019 08:43 AM - edited 06-05-2019 08:45 AM
- Mark as New
- Bookmark
- Subscribe
- Mute
- Subscribe to RSS Feed
- Permalink
- Report to a Moderator
Thank you for your response cbutcher.
No the graph does not report values in the resolution I need. So this seems to be PC issue, not code issue. Is that right?
Eventually I am actually in need of conducting logging at 5 kHz. I just wanted to start at 1 kHz first and see how it looks like.
What is puzzling is that if I implement this in LabVIEW SignalExpress, there is no issue logging at 1 kHz or 5 kHz
I am wondering now how can I conduct high frequency logging in the development environment of LabVIEW?
06-05-2019 08:54 AM
- Mark as New
- Bookmark
- Subscribe
- Mute
- Subscribe to RSS Feed
- Permalink
- Report to a Moderator
@scazorla19 wrote:
Thank you for your response cbutcher.
No the graph does not report values in the resolution I need. So this seems to be PC issue, not code issue. Is that right?
Well, that's arguable... but really it can be fixed with the suggestions I described (I'm pretty sure based on your answers).
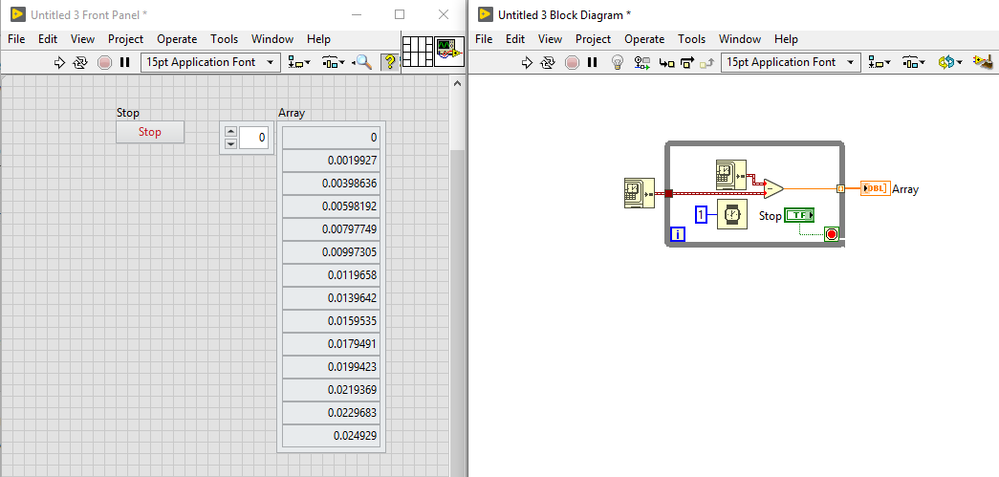
Here's a trivial example I put together that shows the problem you're likely having (or at least something close)
Here my code does nothing in the loop except get the time and wait 1ms, but the timestamps are not 1ms apart - they're all more! Almost double, in fact.
This is running on a reasonably speedy laptop. You have "far more" code in your loop (acquiring from hardware etc).
You can't really run a loop that fast on Windows. However, this doesn't mean that you can't reliably acquire data at that speed. Just take more data samples per iteration and slow down the loop.
Perhaps you can post your VI again after you've made (or tried to make) the modifications I suggested and let us know if it works out for you.
06-05-2019 09:08 AM
- Mark as New
- Bookmark
- Subscribe
- Mute
- Subscribe to RSS Feed
- Permalink
- Report to a Moderator
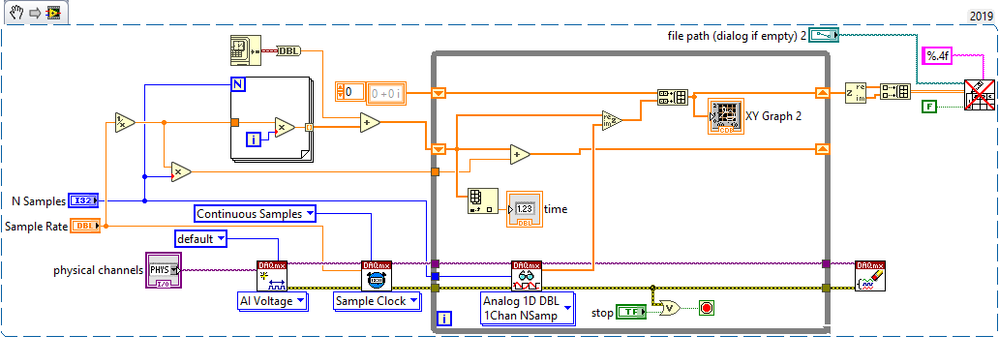
Actually, here's an example that uses Complex Values to simplify plotting. I haven't used this really but I've seen it promoted by altenbach many times and it certainly simplifies wiring. I'm converted back to a 2D array outside the loop because I'm not sure what you'll get if you log the complex values.
I index the SR value to get the start time of each iteration, although since I'm adding the Time Stamp (you seemed to want this in your example) the value isn't terribly useful with a standard representation.
06-05-2019 02:29 PM
- Mark as New
- Bookmark
- Subscribe
- Mute
- Subscribe to RSS Feed
- Permalink
- Report to a Moderator
Thanks cbutcher. Can you please save the file to V14? Currently I cannot open it.


