- Subscribe to RSS Feed
- Mark Topic as New
- Mark Topic as Read
- Float this Topic for Current User
- Bookmark
- Subscribe
- Mute
- Printer Friendly Page
Continously Plotting Data (single temperature data point)
11-28-2016 01:25 PM
- Mark as New
- Bookmark
- Subscribe
- Mute
- Subscribe to RSS Feed
- Permalink
- Report to a Moderator
Hello all,
I'm needing some help on my program
Below is a picture of my block diagram, its pretty simple and it does do what I need it to do (which is read a watlow controller and plot the temp and than save it to a txt file, until a user presses stop)
Its working OK, but the thing I need help on is how do I get the program to keep every single data point captured (from the very start) to the very end - on the front panel plot?
For example, i'm running a test for 90 hours, and the watlow is configured to do a certain temp cycle where it goes from -40C to 85C, at different intervals
I need the program to keep the all temp data plotted on the front panel graph (for the full 90 hour. Right now its only keeping like the latest 10 minutes
I'm assuming this has to do with memory and I just simply can't keep that many data points on a graph at on time
Is there something I can configure in my code differently? Should I only take a reading and plot it every 1 minute or something?
Only thing i'm plotting is time and temp.
Any help would be appreciated
Let me know if you need any more details from me (I realize my block diagram is not the most effecient or well organized, but its just a starting draft for me right now)
11-28-2016 01:35 PM
- Mark as New
- Bookmark
- Subscribe
- Mute
- Subscribe to RSS Feed
- Permalink
- Report to a Moderator
Hey Bpatel,
Check out this article on Graphs and Charts in LabVIEW. Should get you going in the right direction
http://digital.ni.com/public.nsf/allkb/95FEE9F5B252507E862562BA00007657
Respectfully,
Systems Engineer
National Instruments
11-28-2016 09:45 PM
- Mark as New
- Bookmark
- Subscribe
- Mute
- Subscribe to RSS Feed
- Permalink
- Report to a Moderator
You need to think about what you are doing and what is reasonable to plot. Let's say you take 1 point a minute (to say nothing of one point/second) -- in 90 hours, you will have 90 * 60 = 5400 points. If you plot them all, you will need 5400 pixels. A wide screen might have 2000 pixels, so you'd need three screens to plot everything. And if you are, indeed, doing one point per second, you'd need about 150 screens.
Do you know the difference between a (LabVIEW) Chart and a Graph? Do you know what a Chart Recorder is? You can easily plot 90 hours on a chart, but it takes a lot of paper ...
Bob Schor
11-29-2016 03:11 AM
- Mark as New
- Bookmark
- Subscribe
- Mute
- Subscribe to RSS Feed
- Permalink
- Report to a Moderator
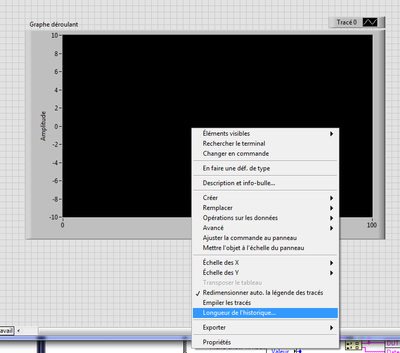
You need to change the number of point in the graph like this:
Sorry, it's in french but you'll figured out.
Just so you know, more point you save more memory it takes and ur computer will eventually crash so choose wisely.

