- Subscribe to RSS Feed
- Mark Topic as New
- Mark Topic as Read
- Float this Topic for Current User
- Bookmark
- Subscribe
- Mute
- Printer Friendly Page
Aglient 34401A Multimeter Issue Graphing with Triggers
02-24-2017 01:01 PM
- Mark as New
- Bookmark
- Subscribe
- Mute
- Subscribe to RSS Feed
- Permalink
- Report to a Moderator
I am working on graphing the output voltage received from a Yokogawa GS200 into a Agilent 34401A. I have adapted the code from the driver for graphing the voltage. The results are very inaccurate, an example attached where the voltage is changing over time and the results are not what would be expected. If possible would I be able not use triggers and use time? I am still new to this and have put in some research but have not found a solution.
02-24-2017 03:19 PM - edited 02-24-2017 03:42 PM
- Mark as New
- Bookmark
- Subscribe
- Mute
- Subscribe to RSS Feed
- Permalink
- Report to a Moderator
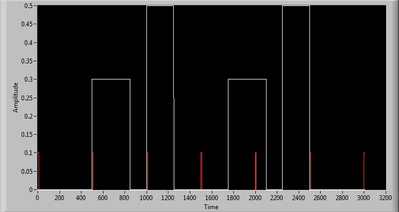
It is likely you are not constantly sampling. According to your screen cap and code, for seven triggers, you are sampling once every 500ms (for 10 samples of unknown interval). Assuming 1ms interval, the samples would take place like this: (red spikes are sample times)
The resultant sample chart would look exactly as you posted.
03-01-2017 07:30 AM
- Mark as New
- Bookmark
- Subscribe
- Mute
- Subscribe to RSS Feed
- Permalink
- Report to a Moderator
How would I be able to assign the interval a time, for example 1 ms. Is this possible?
03-01-2017 07:45 AM
- Mark as New
- Bookmark
- Subscribe
- Mute
- Subscribe to RSS Feed
- Permalink
- Report to a Moderator
03-01-2017 09:11 AM
- Mark as New
- Bookmark
- Subscribe
- Mute
- Subscribe to RSS Feed
- Permalink
- Report to a Moderator
The driver for the 34401 (Multipoint configuration) says the interval can't be adjusted. You need to read the manual to get the interval (if any), then just adjust the delay between triggers to get your sample rate where you want it.


