- Subscribe to RSS Feed
- Mark Topic as New
- Mark Topic as Read
- Float this Topic for Current User
- Bookmark
- Subscribe
- Mute
- Printer Friendly Page
bug in Data Dashboard Android phone
11-06-2015 11:22 AM - edited 11-06-2015 11:23 AM
- Mark as New
- Bookmark
- Subscribe
- Mute
- Subscribe to RSS Feed
- Permalink
- Report to a Moderator
Hello,
I try to use LabVIEW Data Dashboard on an Android Phone (Moto X 2013, Android 5.1 stock version).
Data Dashboard version: 1.0
I connect my phone to my laptop using an Ad-hoc wifi connection, and all is OK, after opening the proper inbound ports on my Win7 firewall.
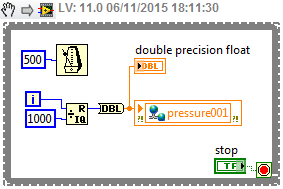
I just used this as a test app:
I can properly see the correct values when I select the simple numeric indicator in the DD app on my smart phone. However,
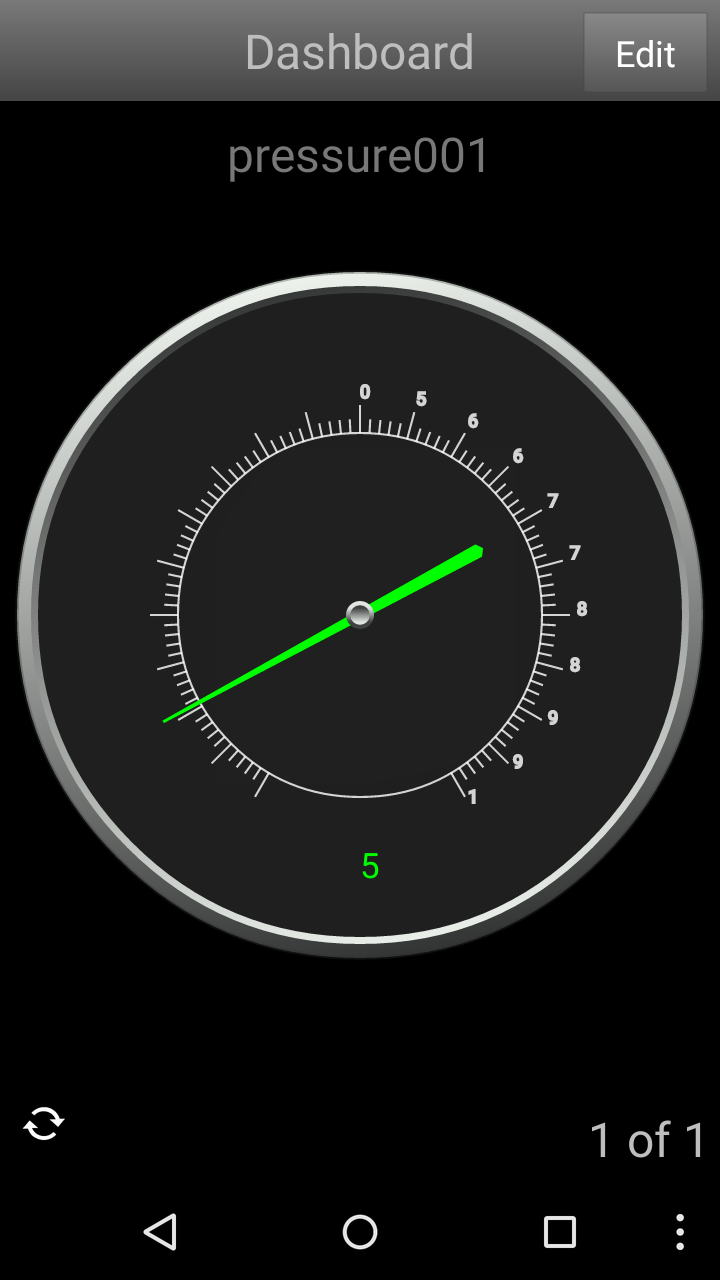
when I try to use the circular guage indicator, it just shows silly numbers at the ticks, but the arrow seems to be at the correct positions:
I selected intervals from 0 to 1000. I also tried other intervals, but I can never get a proper indicator.
Is this Android app totally abandoned by NI? Of course I can just use the simple numeric indicator, but I wonder why this app does not work as it should?
Thanks!
edit: the little green number in the bottom is also showing wrong values.
11-11-2015 08:05 AM
- Mark as New
- Bookmark
- Subscribe
- Mute
- Subscribe to RSS Feed
- Permalink
- Report to a Moderator
Hello,
thanks for reporting your concern with the Data Dashboard.
Are you able to use the Chart Diagram on your Phone and does this one work properly?
Unfortunately I’m not able to reproduce it on my Phone (Nexus 5).
If anyone else has a similar issue with the circular gauge please reply.
11-11-2015 09:29 AM
- Mark as New
- Bookmark
- Subscribe
- Mute
- Subscribe to RSS Feed
- Permalink
- Report to a Moderator
Thanks for the feedback! Ok, so it looks like this bug is phone specific...
Actually I can see the correct values in the Chart Diagram, however the number labels are too tiny, so the chart is useless (and also too thin curve).
I made a conclusion that if I need to use the built in numeric charts or indicators, I just should go for a tablet + the newer version of DD.
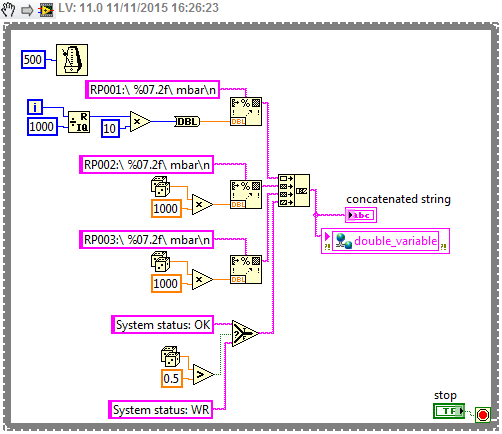
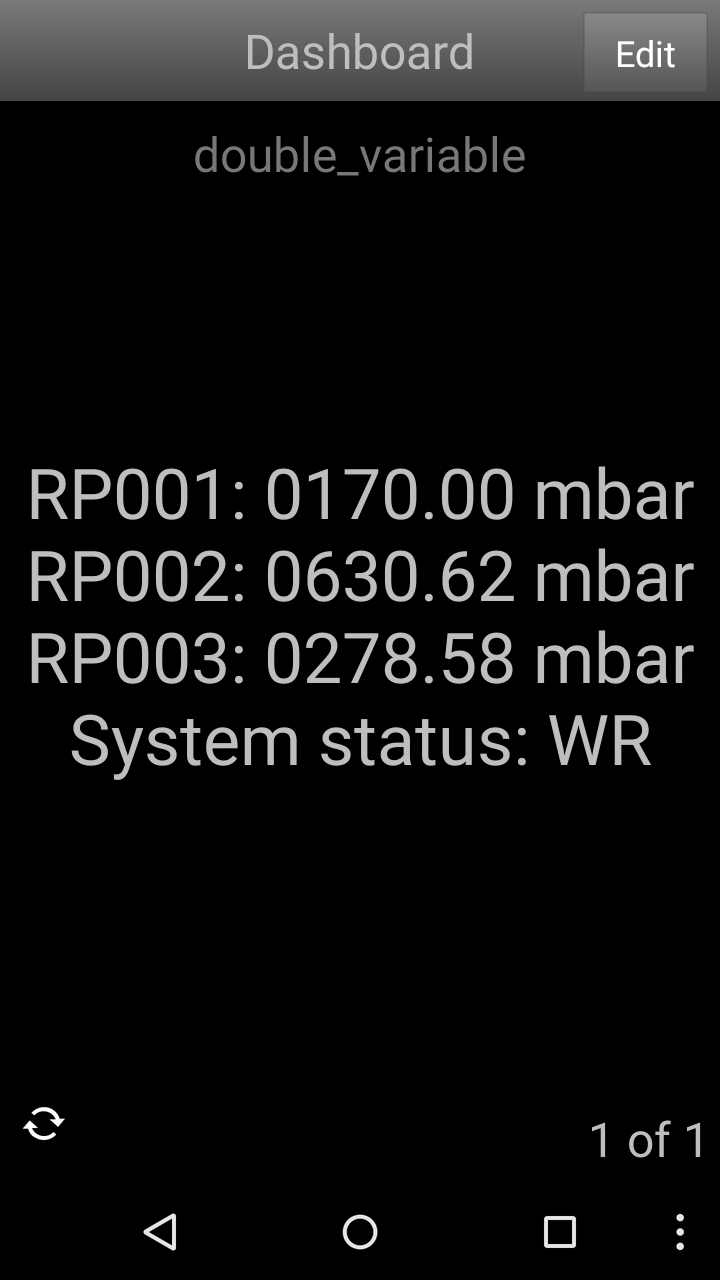
But as a workaround, if I must use smart phones, I will just use a simple string indicator, no history, but I can transmit multiple variables (so as much info as needed) through a single shared variable (string type, i forgot to change the name from the last "double_variable"):
11-24-2015 07:39 AM
- Mark as New
- Bookmark
- Subscribe
- Mute
- Subscribe to RSS Feed
- Permalink
- Report to a Moderator
Great way to update several variables at once.
Thanks for sharing!


