Start at Zero with Relative Time using Waveform Data in Charts
- Subscribe to RSS Feed
- Mark as New
- Mark as Read
- Bookmark
- Subscribe
- Printer Friendly Page
- Report to a Moderator
Products and Environment
This section reflects the products and operating system used to create the example.To download NI software, including the products shown below, visit ni.com/downloads.
- Data Acquisition (DAQ)
Hardware
- LabVIEW
Software
- NI DAQmx
Driver
Code and Documents
Attachment
Overview
This example shows how to shows relative time in waveform chart.
Description
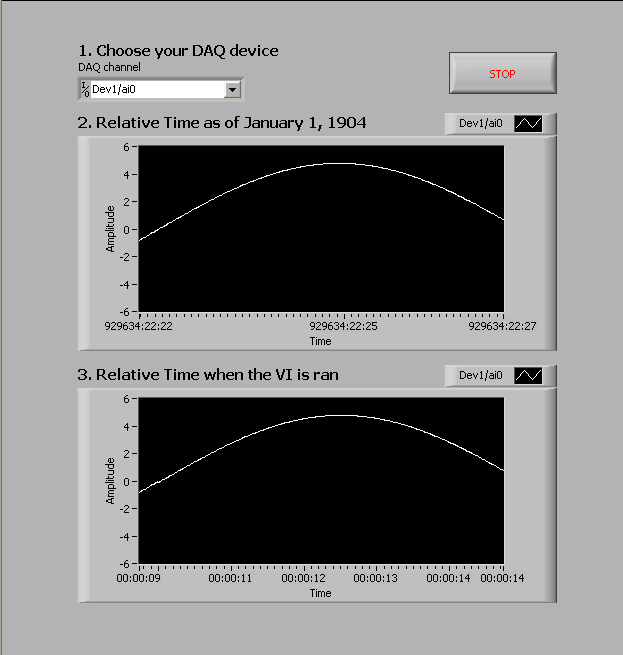
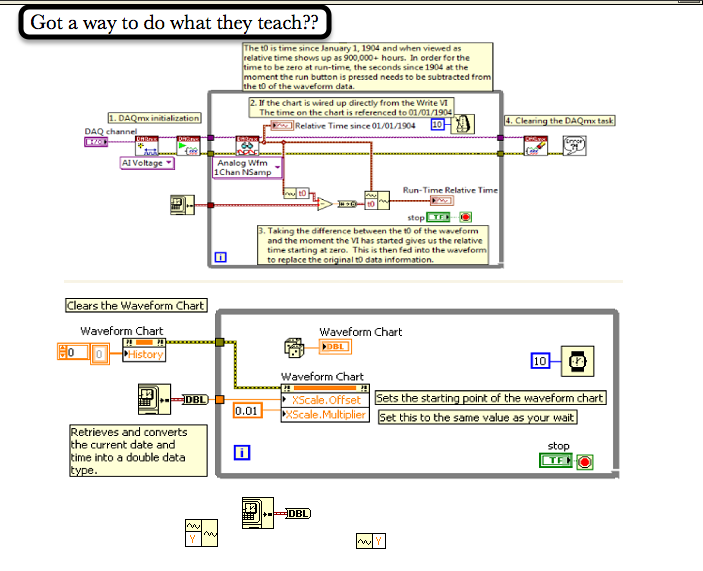
Within the waveform data there exists many different components, one of those components is the time stamp information. The time stamp information can be confusing and may create results that weren't expected. After going through this example you should have a better understanding of the time stamp data.The time stamp data is the number of seconds elaped since 12am, Friday, January 1, 1904, Universal Time. Labview then formats these seconds into the absolute time depending upon your computer's information about time zone and daylight savings.This allows using absolute time with charts very convenient, however it is not so easy to get relative time using waveform data in charts. In order to display the relative time in terms of when the VI was started, that moment at run-time must be known to the program. If the difference is taken between the run-time stamp and the waveform time stamp you will get how many seconds have elapsed since the moment you ran the VI. The image below shows what the chart would show if directly wired with waveform data and the chart that shows the timing axis that starts at zero at run-time.The t0 is time since January 1, 1904 and when viewed as relative time shows up as 900,000+ hours. In order for the time to be zero at run-time, the econds since 1904 at the moment the run button is pressed needs to be subtracted from the t0 of the waveform data.
Requirements
Software
- LabVIEW 2012 or compatible
- NI-DAQmx 9.5.5 or compatible
Hardware
- NI Multifunction DAQ Device
Steps to Implement or Execute Code
- Configure the parameter for the right channel and device
- Connect your hardware appropriately
- Run the VI
Additional Information or References

**This document has been updated to meet the current required format for the NI Code Exchange.**
Applications Engineer
Example code from the Example Code Exchange in the NI Community is licensed with the MIT license.
- Mark as Read
- Mark as New
- Bookmark
- Permalink
- Report to a Moderator
Can you make a pix of the programming panel? My LabVIEW 8.0 does not allow me to see how you got the relative time!
- Mark as Read
- Mark as New
- Bookmark
- Permalink
- Report to a Moderator
Done
Applications Engineer
- Mark as Read
- Mark as New
- Bookmark
- Permalink
- Report to a Moderator
 Scott:
Can you do this in LV 8.0 I can not find the tools. Where is the squiggly T0. I found waveform stuff but nothing that looks like that.
Got a more straightforward way. See the 2 ways above I have tried. Seems like take time at 1904 and subtract from now and then start there.
Can you turn on the labels too?
Does this work in LV 8.0?
- Mark as Read
- Mark as New
- Bookmark
- Permalink
- Report to a Moderator
the t0 is located within the "Build Waveform Components" that you have on your block diagram, you need to click on the orange Y and change it to t0. I have attached v8.0 of this file so that you can open it up
Applications Engineer
- Mark as Read
- Mark as New
- Bookmark
- Permalink
- Report to a Moderator
Scott! All I can say is WOW and thanks a ton for your help. I must say it is ALWAYS so refreshing to work with folks like you at NI because it is very clear to me that an EXTRAORDINARY "culture" exists at NI that is EXACTLY why you guys are so successful!
So thanks for being an example that I hope other companies will follow and I know I always strive to do as well as NI!
So, one last thing, if you will... What about adding one more eeny beeny thing.. Having the time be relative to when the graph started. Not ZERO based but if I start the grpah at 9:45 PM, local time, that is what is shown on the graph. This is handy for processes where folks want to correlate the data points to the local time.
If one were monitoring traffic at a corner in a city we would want to see what happens directly related to local time... Like the corner may show 236 cars at 12 Noon...
Thanks again Scott and see if you guys can keep up making 8.0 rev versions for us old farts who still love 8.0
Dave
- Mark as Read
- Mark as New
- Bookmark
- Permalink
- Report to a Moderator
A review is in order here.. Not so much because of a super complicated problem but to acknowledge the EXTRAORDINARY customer service that Scott is giving users. It is not uncommon to see this at NI. It is more the RULE than the exception.
So I am writing this to invite YOU readers to do what Scott does for NI and DO THAT for YOUR customers. This way more business will stay in the US and not be farmed out to wherever.
If you are working on a hot new product or a method to provide YOUR customers with exceptional support consider getting a Provisional Patent on it.
I think NI has a patent on their business method that is not at risk of having to defend! The NI patent is"A Novel Method Of Customer Service Where Customers Are Treated As If They Really Matter" I think they got it 12 years ago so they only own the patent monopoly for another 8 years .
As I see it they are not much in danger of having to defend their patent... Well.. perhaps the folks at IN-N-OUT-BURGER are totally copying the NI patent. If you are in California please go to an IN-N-OUT-BURGER to experience it yourself...
Thanks guys for making my job easier and providing exceptional support.
- Mark as Read
- Mark as New
- Bookmark
- Permalink
- Report to a Moderator
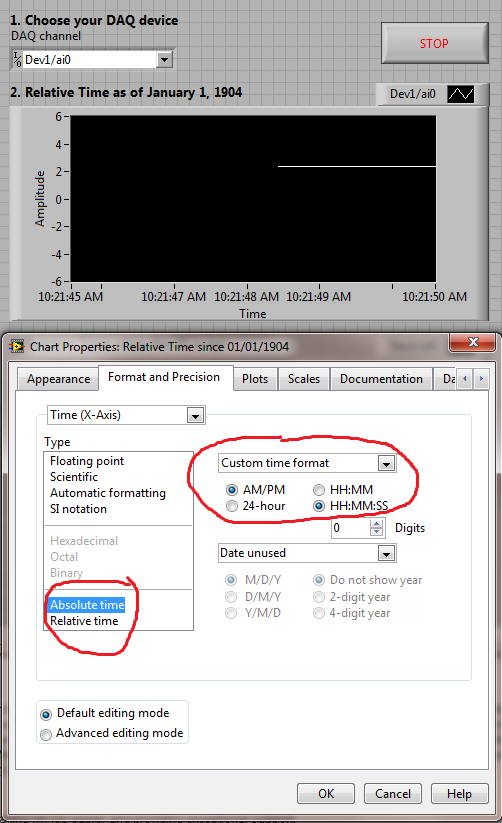
Thanks for your kind words, to answer your question, in order to see the absolute time (eg, 10:16AM) of the chart you only need to change the properties of the chart. If you change the properties of the chart that doesn't have the adjusted time, you will get the absolute time. Let me know if you have any other questions.

Applications Engineer
- Mark as Read
- Mark as New
- Bookmark
- Permalink
- Report to a Moderator
How about multi channels?
- Mark as Read
- Mark as New
- Bookmark
- Permalink
- Report to a Moderator
Thanks!
- Mark as Read
- Mark as New
- Bookmark
- Permalink
- Report to a Moderator
+1
who can tell us?
- Mark as Read
- Mark as New
- Bookmark
- Permalink
- Report to a Moderator
How about multi channels?
+1
who can tell us?

