Description
Description-Separate-1Overview
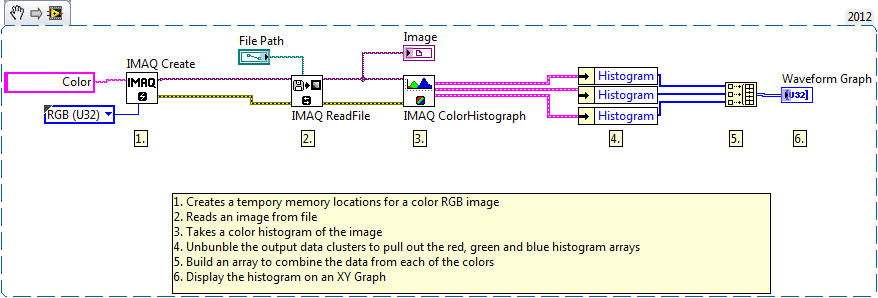
This example shows how to take a histograph of a color image and display it on a graph.
Description
After creating a temporary memory location for a color RGB image, IMAQ ReadFile.vi reads in an image from a specified file path and outputs the image to the IMAQ ColorHistograph.vi. The three planes of the image are unbundled to pull out the red, blue, and green data arrays and are then built into a 2D array to be displayed on a graph.
Steps to Implement or Execute Code
- Specify the File Path to your desired image on the Front Panel
- Run the VI
Requirements
Software
LabVIEW 8.6 or later
Vision Development Module 8.6 "or compatible" Compatibility Link
Additional Information or References
VI Snippet
**This document has been updated to meet the current required format for the NI Code Exchange. For more details visit this discussion thread**
Description-Separate-2