Description:
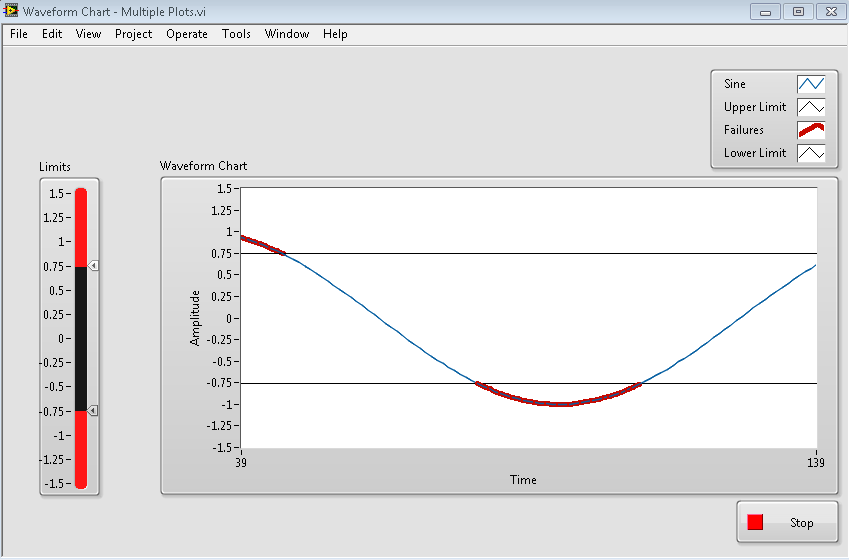
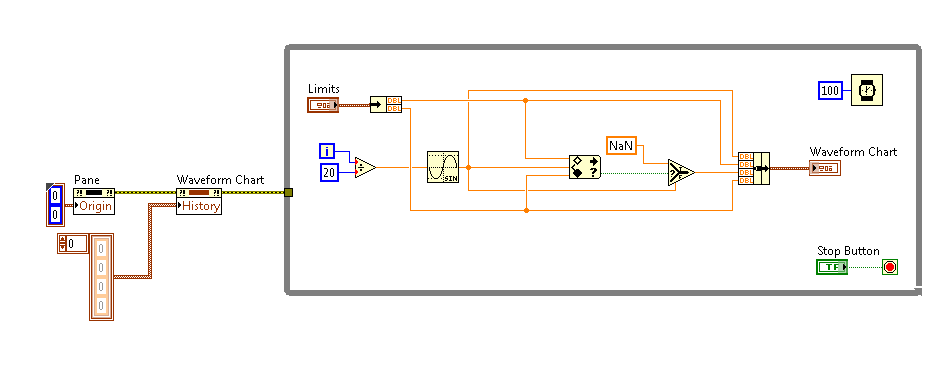
This example shows how to use the bundle function to display more than one plot on a single waveform chart with the added functionality of displaying the graph failures in a different colour.
Four different plots are used to achieve this, these include:
1. Sinewave data
2. Upper Limit
3. Lower Limit
4. Failures
When the Sinewave data moves outside the boundary limits the failures can be seen in a different plot colour.
This example also shows how to reset the chart data to zero on each run using the chart "History" property.
Requirements:
The code is compiled for LabVIEW 2010 or later but all the functionality is available in previous versions of LabVIEW.
Images: