- Document History
- Subscribe to RSS Feed
- Mark as New
- Mark as Read
- Bookmark
- Subscribe
- Printer Friendly Page
- Report to a Moderator
- Subscribe to RSS Feed
- Mark as New
- Mark as Read
- Bookmark
- Subscribe
- Printer Friendly Page
- Report to a Moderator
Using VI Analyzer to Review LabVIEW APIs
You can use the VI Analyzer Toolkit to review APIs prior to submission for the LabVIEW Tools Network review process. These tests can identify issues with documentation, style, and performance to ensure your LabVIEW code is at the quality level customers expect to find in products listed on the Tools Network. This document contains a tutorial demonstrating how you can use VI Analyzer tests as part of your product review.
The test configuration included with the tutorial below is used to automate identification of the following list of LabVIEW Tools Network Style Requirements along with other performance and documentation checks. For example, VI Analyzer can check for the use of case structures to handle errors passed through VIs and even perform a spell check of comments and documentation.
LabVIEW Tools Network Style Requirements
| A consistent font is used throughout all VIs |
| VIs use path controls instead of string controls for specifying locations of files and folders |
| Controls and indicators do not overlap on the front panels |
| Data flows from left to right |
| All functions, terminals, and constants are aligned and distributed on the block diagram |
| Objects are not placed on top of wires |
| API VIs use consistent (4x2x2x4 or 5x3x3x5) connector pane patterns |
| Common or consistent terminals, such as for references or classes, are used across all API VIs |
| Error wire terminals are always at the bottom left and bottom right |
| All VIs contain a VI description for the Context Help Window |
| Comments are used in all VI block diagrams to document code |
Using VI Analyzer
The attached Compatible_with_LabVIEW-Example.cfg file is a sample test configuration for the 'Agilent 34401' API shipped with LabVIEW and found under \instr.lib\Agilent 34401\. You can use this configuration as a starting point for reviewing your APIs.
- Download the attached Compatible_with_LabVIEW-Example.cfg file.
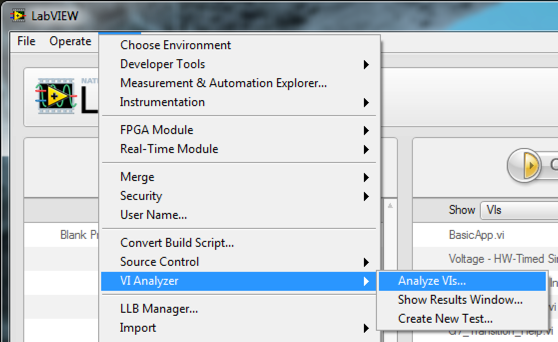
- Launch VI Analyzer from the LabVIEW>Tools>VI Analyzer>Analyze VIs... menu entry.
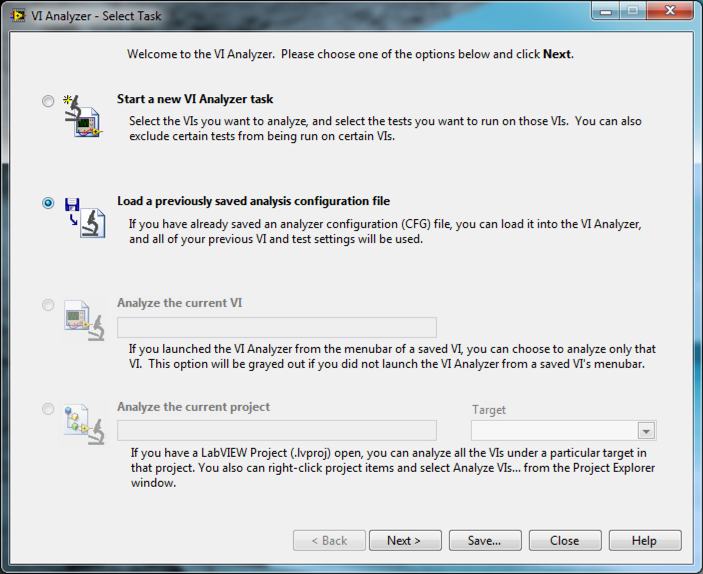
- Select Load a previously saved analysis configuration file and click Next.
- Navigate to the Compatible_with_LabVIEW-Example.cfg file downloaded from this page.
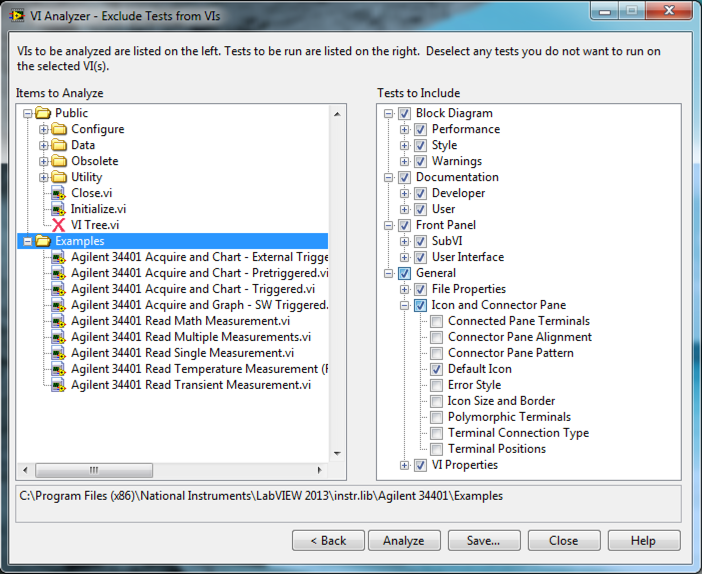
- Review the files included in the Select VIs dialog. These are all customer facing VIs found in either the LabVIEW palette or NI Example Finder.

- Click Next.
- Review the configuration selected for this example—notice the selected tests and browse through options to tune them. I've itemized the selected tests for the attached configuration below:
- Block Diagram
- Performance
- Building of arrays and strings in loops
- Coercion dots
- Enabled debugging
- In Place element structure usage
- Inlinable VIs
- Prepend scalar with build array
- Wait in While Loop
- Style
- Code simplification
- Control terminal label visible
- Control terminal wiring
- Mixed terminal styles
- Sequence structure usage
- String constant style
- Tunnel position
- Unused code
- Wire bends
- Wires under objects
- Performance
- Warnings
- Adding array size elements
- Array sum and product overflow
- Breakpoint detection
- Bundling duplicate names
- Error cluster wired
- For Loop iteration count
- Globals and locals
- Hidden objects in structures
- Hidden tunnels
- Indexer datatype
- Pattern label
- Reentrant VI issues
- Type casting references
- Typedef cluster constants
- Documentation
- Developer
- Comment usage
- User
- Spell check
- VI documentation
- Developer
- Front Panel
- SubVI
- Array default values
- Cluster sized to fit
- Control alignment
- SubVI
- User Interface
- Clipped text
- Dialog controls
- Duplicate control labels
- General
- File Properties
- VI extension
- VI name
- VI size
- Icon and Connector Pane
- Connector pane terminals
- Connector pane alignment
- Connector pane pattern
- Default icon
- Error style
- Icon size and border
- Polymorphic terminals
- Terminal connection type
- VI Properties
- Broken VI
- Built application compatibility
- File Properties
- Block Diagram
- After browsing through the selected test cases, click Next to review the test selection. Here you can configure which tests to apply to your API VIs. For example, example VIs may not need the same connector pane tests as an API VI.
- Click Analyze to begin test execution.
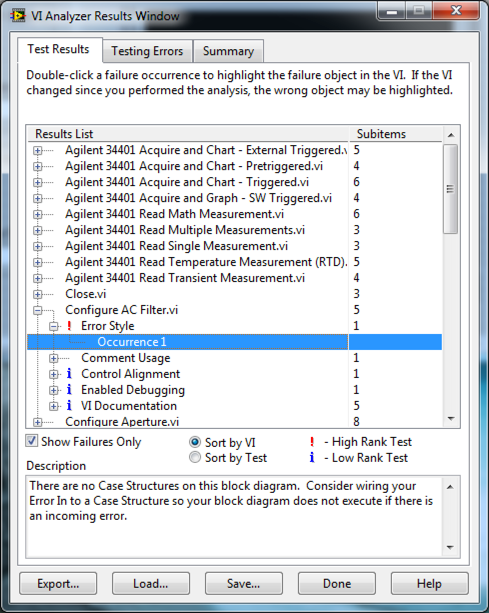
- The VI Analyzer Results Window gives you the ability to jump from a test failure entry to the location in your source code by double-clicking on the test entry. In the image below, an API function is not making use of an error case structure to avoid executing code when errors are present. In some cases this is intended behavior (cleaning up a reference) and in others this issue would need to be corrected.
We strongly encourage you to incorporate VI Analyzer testing into your prerelease review process to ensure code is at a high level of quality prior to sending your product or update to the LabVIEW Tools Network team.
