- Document History
- Subscribe to RSS Feed
- Mark as New
- Mark as Read
- Bookmark
- Subscribe
- Printer Friendly Page
- Report to a Moderator
- Subscribe to RSS Feed
- Mark as New
- Mark as Read
- Bookmark
- Subscribe
- Printer Friendly Page
- Report to a Moderator
myDAQ mini-lab: Op Amp I -- Terminal voltages
Course Linkage: Linear Circuit Analysis >> Operational Amplifiers >> Terminal Behavior
Measurement Techniques: ELVISmx DMM (voltmeter)
<hr width="75%">
Introduction
Overview: An operational amplifier (or “op amp”) integrated circuit serves as the heart of a wide variety of useful circuits including audio amplifiers, filters, comparators, and integrators. An op amp accepts two voltage signals as inputs and applies a large gain to the difference of the two input signals. Amplification requires an energy source; consequently the op amp requires connections to a power supply.
Objectives: In this mini-lab you will:
- Measure the terminal voltages of an op amp
- Determine the saturation voltages of the op amp
- Plot the input-output voltage characteristic
- Estimate the width of the linear region
Equipment
- NI myDAQ
- Breadboard
- Connecting wire
- Alligator clip test leads
- Texas Instruments (TI) TL072 op amp or similar device
- Resistors, ¼-W 5% carbon film: 1.0K (two)
- LEDs (light emitting diodes) (two)
NOTE: Any dual-supply op amp is suitable for this project. Be sure to use the correct pin numbers, though, because these vary from one device to the next. Refer to the data sheet for your device (search www.datasheetcatalog.com) or ask your instructor for assistance.
Deliverables
- Submit your work in the form of a homework set problem or lab notebook entry according to the requirements of your instructor
- Submit your work for each underlined boldface item, and clearly label the item with its section letter and task number
A. Experience the op amp terminal voltages by measurement
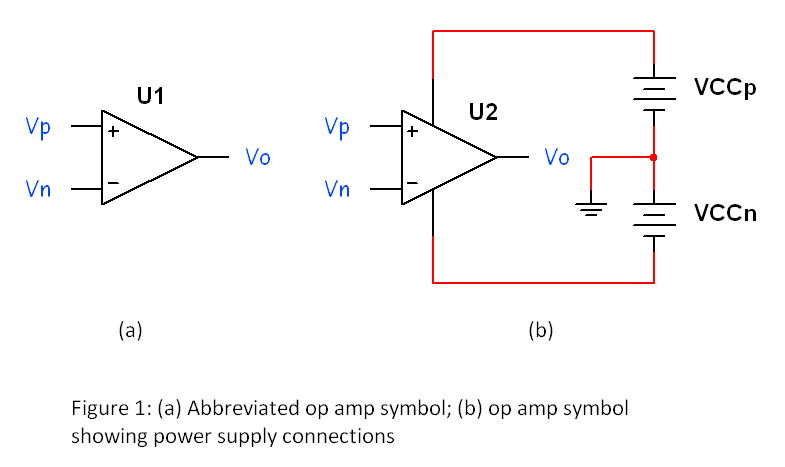
- Draw the circuit of Figure 1b, a generic op amp connected to its power supply.
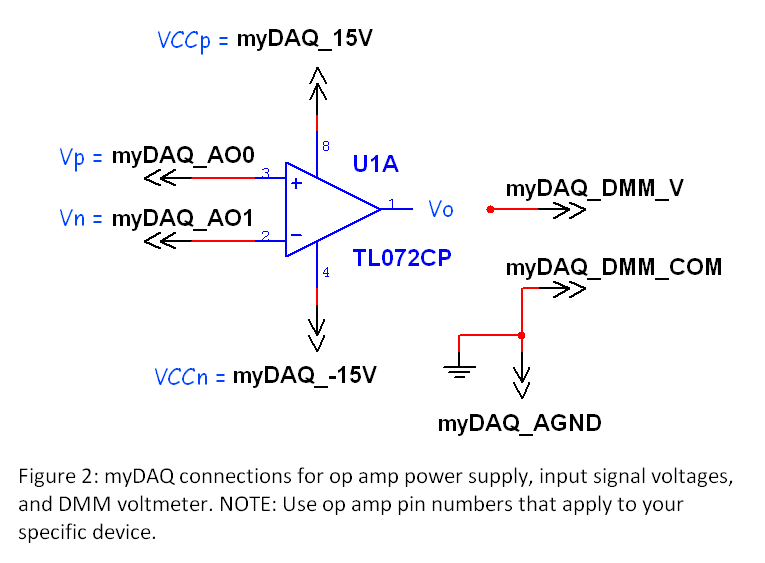
- Draw the circuit of Figure 2, the TI TL072 op amp (or your specific op amp, if different) connected to myDAQ.
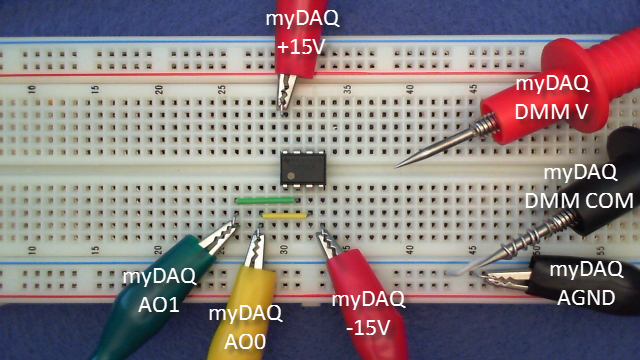
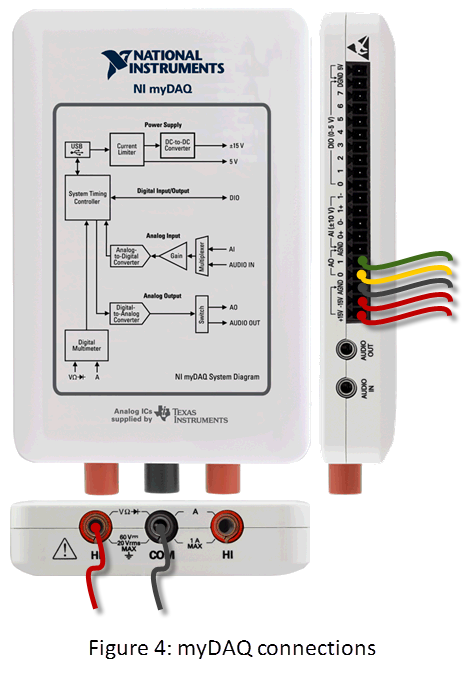
- Construct the circuit of Figure 2 with myDAQ and a breadboard; see Figure 3 for the recommended layout and Figure 4 for the myDAQ connections.
- Connect the DMM COM (black) probe permanently to ground to save effort. Use probe clips if you have them available, or coil a wire around the probe tip with one end of the wire long enough to connect into the breadboard.
TIP: Wrap the wire around the probe tip to form a coil, remove the coil and bend it slightly, and place it back on the coil (bending the coil ensures a snug fit):
- Download and run “Set AO Voltage.vi” linked at the bottom of this document. Use this VI to operate the analog outputs AO0 and AO1 as variable voltage sources applied to the ‘+’ and ‘-‘ signal inputs of the op amp.
- Start the ELVISmx DMM and configure it as a DC voltmeter with autoranging mode.
- Measure and record the myDAQ +15V supply voltage; this is labeled as VCCp on the circuits of Figures 1 and 2. Touch the red DMM probe directly to the op amp pin to ensure that the device connects properly to the power supply.
- Measure and record the myDAQ -15V supply voltage; this is labeled as VCCn on the circuits of Figures 1 and 2.
- Measure the signal directly at the ‘+’ pin of the op amp; this is labeled as Vp on the circuits of Figures 1 and 2. Vary the AO0 slider of “Set AO Voltage” to confirm that the applied voltage does indeed appear at the pin.
- Measure the signal directly at the ‘-‘ pin of the op amp (this is labeled Vn) and vary the AO1 slider; ensure that the voltage appears correctly at the pin.
- Connect the DMM V (red) probe permanently to the op amp output Vo with a coiled wire as you did for the COM probe.
- Operate the two sliders of “Set AO Voltage” to manipulate the voltages applied to the op amp signal inputs Vp and Vn. You can also type values directly into the digital displays at the top of the sliders. Observe the output voltage Vo displayed on the DMM. Summarize the output behavior of the op amp for three conditions: (1) Vp greater than Vn, (2) Vp less than Vn, and (3) Vp equal to Vn.
The following video shows some expected results for this section.
B. Learn the underlying principles
The following video tutorial introduces the op amp in more detail, including:
- Mathematical model of the op amp
- Three regions of operation (negative saturation, positive saturation, and linear)
- Supply rails
- Input-output voltage characteristic
C. Connect the principles to your measurements:
- Set Vn (AO1) to 2.00 volts.
- Plot the input-output voltage characteristic of your op amp by plotting the value of Vo as Vp (AO0) varies from -10 volts to +10 volts. Draw dashed lines to indicate your measured supply rails.
- Calculate the difference between the positive supply rail and your measured positive saturation output voltage; show this value on your plot.
- Calculate the difference between the negative supply rail and your measured negative saturation output voltage; show this value on your plot.
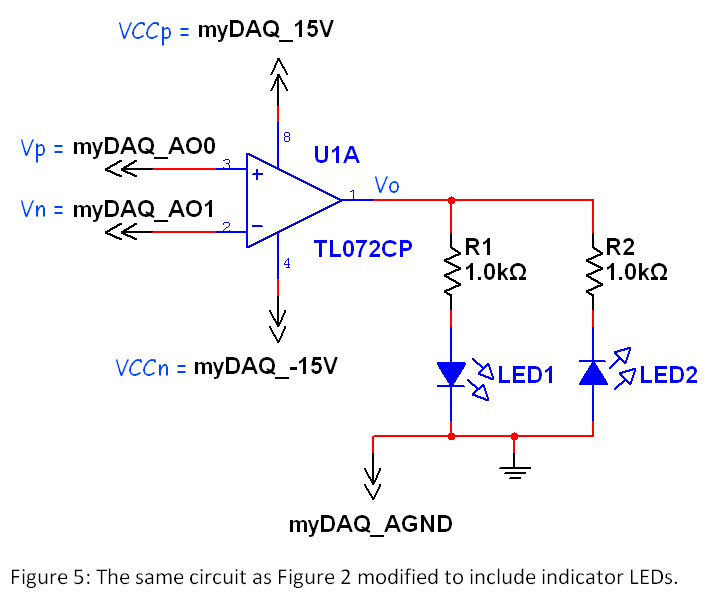
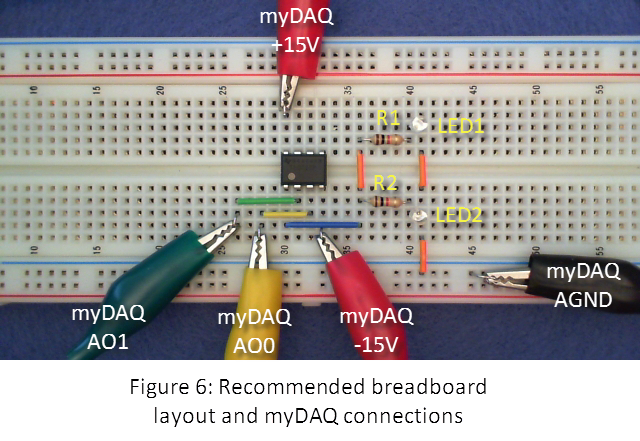
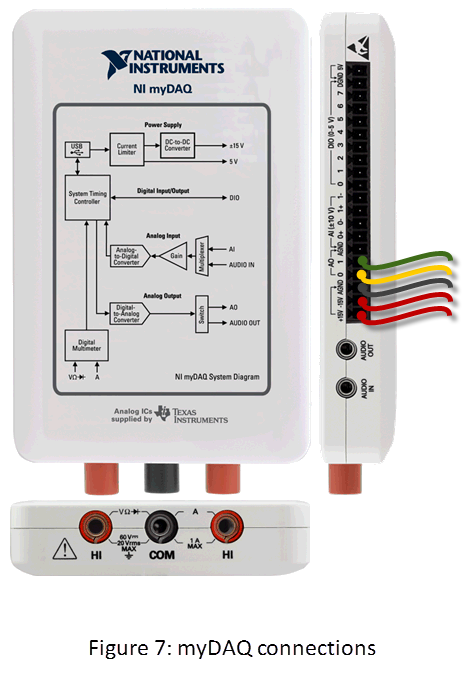
- Add the LED indicators to the output of your op amp as shown by the schematic diagram in Figure 5. Figure 6 shows the recommended breadboard layout and Figure 7 shows the myDAQ connections. LED1 indicates positive saturation and LED2 indicates negative saturation.
- Estimate the range of Vp for which the op amp operates in the linear region. This is a rather tricky measurement because the range is so small. The following video illustrates the measurement technique for this part:
Build your intuition:
Reflect on the following points:
- Answer: Based on your measurements, does your op amp possess “rail-to-rail output” capability, i.e., is the op amp output able to reach the positive and negative supply rails?
- Discuss: Why do you suppose the LEDs tend to flicker in the linear region of operation? What other behavior might you have expected?
For more information
