Purpose:
This experiment is designed to teach you about amplifying signals introduce you to basic digital filtering and reinforce generating data files for later use. This project and report may be done in teams of two. The report is to be in memo format.
Hardware Setup:
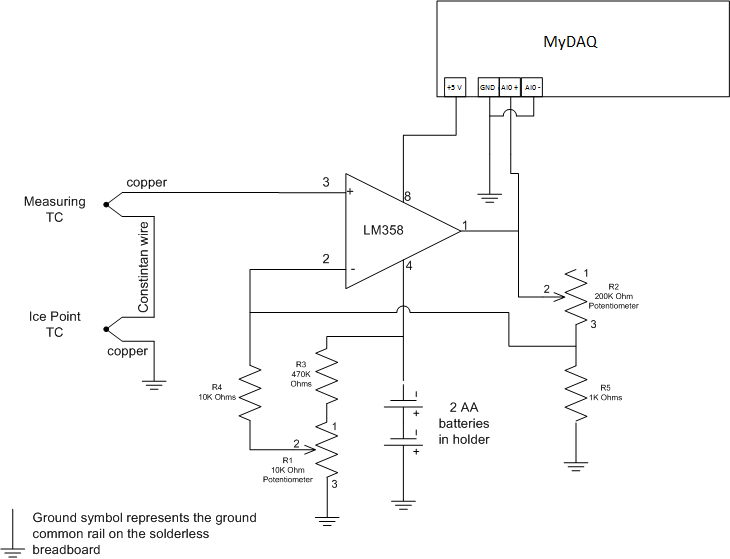
Using the components in your kit, construct the following circuit on your solder less breadboard. Use the long thermocouple for the measurement TC and the short one for the ice point. You may connect the two constantan wires on the breadboard without affecting the calibration of the circuit.
Part 1:
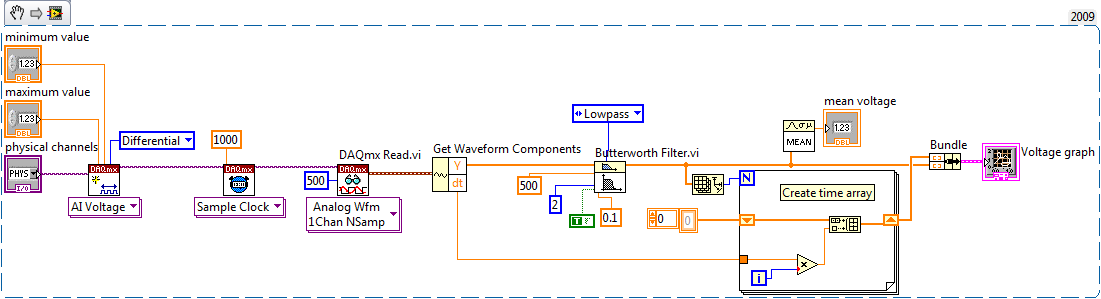
Use the supplied code snippet for the amplifier set-up, adjusting R1 and R2 as follows to calibrate your amplifier. This may take several iterations, but once it is calibrated, you will not have to repeat this procedure unless you change the circuit.
- Testing operation of the circuit involves dropping the ice point TC into an ice bath with the measurement TC in the air. Dipping the measurement TC into the ice should drive the voltage near zero, with the voltage increasing when you take it out and touch it to your hand.
- Once you have this operation working, it's time to calibrate the amplifier following steps 2 and 3 multiple times until you get the appropriate readings. (It's not unusual to have to do it five or six times to iteratively get two pots adjusted.
- With both TC's in the ice bath, adjust R1 for a reading of 0 volts.
- With the measuring TC in a pot of boiling water, adjust R2 for a reading of 0.5 volts.
Notes:
- The supplied code snippet contains a control for you to select which channel and device you are using. Be sure to select Channel 0 on your device before you run the program.
- This program will take data and filter it to remove unwanted noise and give you a stable signal. Since it has a very long settling time, several seconds, you will want to be sure it has settled before you make your reading.
- You must run this program in continous mode for the system to make multiple samples.
Part 2:
Using the program as a base, modify the code so that it will display the mean value in degrees C in addition to the voltage.
You will need to use a formula node to accomplish this and enter the following formula.
Y = 22.63x3 – 55.706x2 + 221.97x + 0.0184
Where Y is temperature out and x is volts input (in volts)
Part 3:
Modify the program to save the temperature in degrees C, and an elapsed time value since the program started, to a file with one sample being saved every 10 seconds.
Part 4:
Place a pan of ice water on the stove. Using the program developed for part 3, record the temperature of the water as it heats to boiling, recording the values in your file. Do not forget to keep the reference TC in a good pan of ice water, or your results will be skewed.
Graph this file in excel to include in your report. Also include one page of your data file with your graph.
LabVIEW Resources:
For help with programming in LabVIEW please review the appropriate videos in our Learn to LabVIEW with MyDAQ Course.
Report and Submission:
Include the VI documentation Front Panel, Block diagram with hidden frames, list of SubVI’s and express VI’s
In your report discuss the results as well as any limitations you noted for this method of amplification.
Include a picture of your circuit in the report.
Consider the following in your report:
- Whatis important about FC value selected for the filter?
- What would happen if the batteries were not connected and pin 4 of the amplifier was connected directly to ground.
