- Subscribe to RSS Feed
- Mark Topic as New
- Mark Topic as Read
- Float this Topic for Current User
- Bookmark
- Subscribe
- Mute
- Printer Friendly Page
Checkstyle Visualization
07-14-2022 06:54 AM
- Mark as New
- Bookmark
- Subscribe
- Mute
- Subscribe to RSS Feed
- Permalink
- Report to a Moderator
I'm currently setting up a new build system and as part of that I'm writing a plugin for the visualization of "Checkstyle" based VI Analyzer results.
I'm using Matt Pollock/DCAF's VI Package to generate the input files (see VI Analyzer Results > Checkstyle Format?).
So far, as a very early draft, I've gotten this:
and so my question for users here is, imagining that you were using this,
- What would you want to see from your VI Analyzer results?
- How would you want to see them?
- How important is relative change between builds (change in these values, rather than absolute values)
- How important is configuring the severity of VIA errors (this is controlled by Matt Pollock's code, I guess, but I haven't looked into configuring it)
- Do you want to see files with no failures? (here they're not shown, because afaik VIA doesn't generate report lines for non-failing files, but I guess it could be added if you like verbosity)
- Should the files be sorted by number of failures or similar? Maybe by name? I'm not sure what the current sorting is, but it's whatever VIA produced I expect... (I haven't made any effort to sort yet, but looking now I think they need some sort of sorting). Should the ordering be configurable (e.g. by failure, by name toggle)?
Some other thoughts include expandable regions (like click on the file, get the errors/warnings/info for that file) or the summary by test below, or similar (or both), but I'm not sure what would be useful here so I'm asking for ideas 🙂
(p.s. the angry errors here are a bunch of class objects with the same name for the control and the indicator... oops 😉 )
07-14-2022 09:14 AM
- Mark as New
- Bookmark
- Subscribe
- Mute
- Subscribe to RSS Feed
- Permalink
- Report to a Moderator
To answer question 3, I think relative values are important.
For example if you inherit a legacy code base with a lot of failures, you're not immediately going to fix them all, so it would be nice to track them and see the numbers going down and make sure you aren't adding any new failures.
CLA, CPI, CTD, LabVIEW Champion
DQMH Trusted Advisor
Read about my thoughts on Software Development at sasworkshops.com/blog
07-14-2022 02:26 PM
- Mark as New
- Bookmark
- Subscribe
- Mute
- Subscribe to RSS Feed
- Permalink
- Report to a Moderator
Looks cool. What's the end goal? I agree that seeing the change between builds is helpful. Though in some ways, knowing the code quality has gone down after it the code built might be less useful than generating this before building/some other trigger. Would the user build again to check if their fixes worked, or would they run VI Analyzer manually?
On 5) I would assume if any users had large projects, they wouldn't want a line for VIs with no errors. Though maybe a count of VIs with no errors would show that it worked properly.
I built something like this once for Azure DevOps, but triggered each commit and only running on the files that were committed. The thinking was that if you've recently made changes to a VI, you're more likely to be willing to fix the things that VI Analyzer flagged on it. I think the email included a report with the names of the rules broken sorted by VI. But nowadays I run VI Analyser locally before code reviews because I like being able to jump to each error to fix them.
07-14-2022 05:02 PM
- Mark as New
- Bookmark
- Subscribe
- Mute
- Subscribe to RSS Feed
- Permalink
- Report to a Moderator
@leahmedwards wrote:
On 5) I would assume if any users had large projects, they wouldn't want a line for VIs with no errors. Though maybe a count of VIs with no errors would show that it worked properly.
This is really useful. I had a situation recently where I was like "Oh wow, my unit tests are running really fast" only to realize it wasn't actually finding my unit tests.
CLA, CPI, CTD, LabVIEW Champion
DQMH Trusted Advisor
Read about my thoughts on Software Development at sasworkshops.com/blog
07-14-2022 09:44 PM
- Mark as New
- Bookmark
- Subscribe
- Mute
- Subscribe to RSS Feed
- Permalink
- Report to a Moderator
@leahmedwards wrote:Looks cool. What's the end goal? I agree that seeing the change between builds is helpful. Though in some ways, knowing the code quality has gone down after it the code built might be less useful than generating this before building/some other trigger. Would the user build again to check if their fixes worked, or would they run VI Analyzer manually?
So this was really only considered in a CI/CD environment, since I'm writing a plugin for a specific CD tool to be able to do something useful with VI Analyzer results (in terms of displaying, potentially failing a build, etc).
I guess, thinking now, since I'm basically doing the same for testing, I could write some wrapper application that just calls the processing steps to produce an HTML file from the XML report... but that would be a secondary/lower priority unless it was something a number of people all wanted now (which seems unlikely, but I could be misjudging this).
@leahmedwards wrote:On 5) I would assume if any users had large projects, they wouldn't want a line for VIs with no errors. Though maybe a count of VIs with no errors would show that it worked properly.
Hmm, yeah, sounds reasonable. That information isn't currently included in the Checkstyle report that Matt's code produces, but it is in the VI Analyzer report, so I can pick it up from there.
@leahmedwards wrote:I built something like this once for Azure DevOps, but triggered each commit and only running on the files that were committed. The thinking was that if you've recently made changes to a VI, you're more likely to be willing to fix the things that VI Analyzer flagged on it. I think the email included a report with the names of the rules broken sorted by VI. But nowadays I run VI Analyser locally before code reviews because I like being able to jump to each error to fix them.
I think that I'll probably stick to having it run on all files, but basically that would depend on the way you generated the upstream VIA/Checkstyle reports - Matt/DCAF's library produces the Checkstyle report based on a cluster of VIA results, and the VIA results depend of course on the config, top level items added, etc.
The code I've currently thrown together takes a config file that runs almost every test, and then uses G-CLI to add the work directory of the build to the top-level items, and runs that.
Presumably a reasonable extra input would be a custom config file, in case some repositories needed different checks running, but I haven't implemented that yet (with G-CLI, it's just expanding Index Array by one output though 🙂 )
07-15-2022 04:37 AM
- Mark as New
- Bookmark
- Subscribe
- Mute
- Subscribe to RSS Feed
- Permalink
- Report to a Moderator
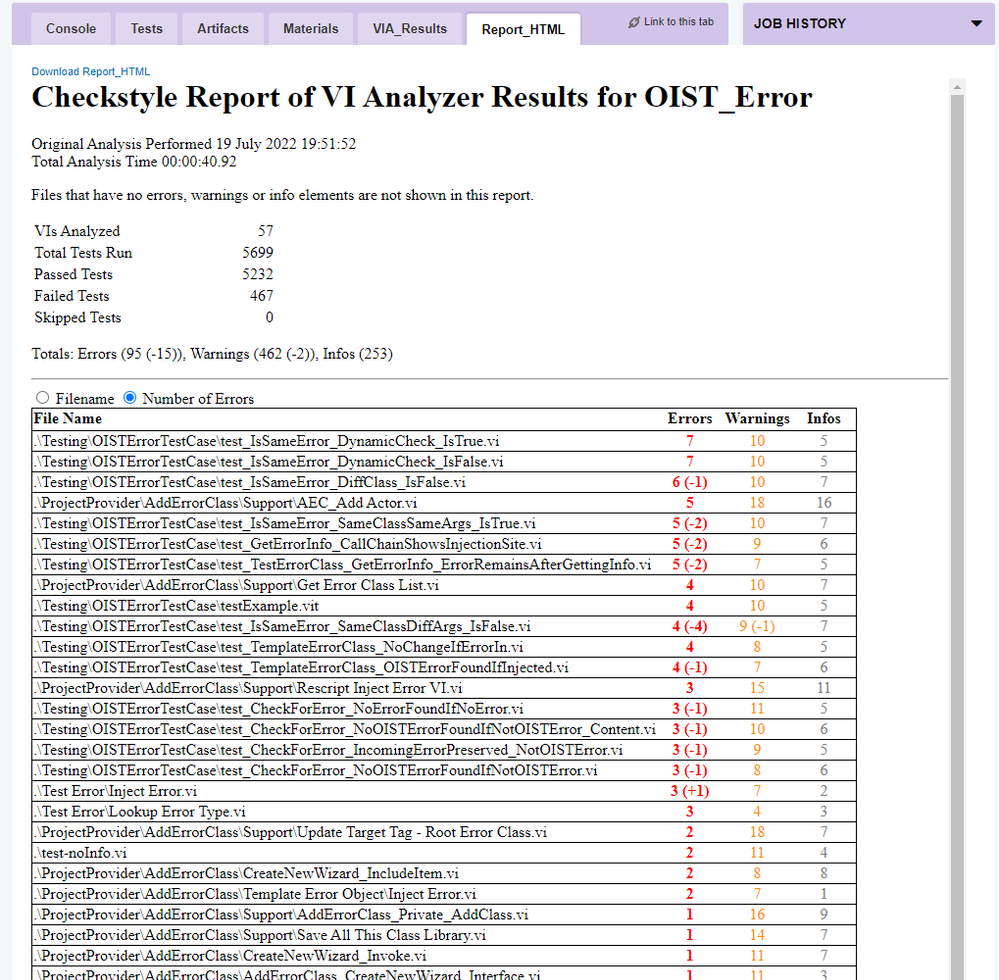
Here's a sample report that I just generated, it now has toggleable entries for the files and a summary at the top, along with potentially hideous colour highlighting (I put a boolean in the generator to turn it off if you prefer, so expect that to be something you could toggle if you used this plugin... Maybe I could also make the colours configurable, but then it starts to become a little heavy on configuration... hmmm :/)
The errors are now sorted by severity, then test type, then message (which you can actually see in the expanded case in this screenshot).
The files are still unsorted, no idea how LabVIEW orders them but now that I've worked out enough jQuery to toggle the boxes, a selectable "by name" or "by number of errors" shouldn't be too hard... (I hope? hmm... actually, not sure).
Obviously I have no idea who wrote code that generates 467 failed tests... 🙈 (but in my not very realistic defence, most of this is scripting or test code...?)
HTML file attached as a zip to play with for those who are curious. Javascript code embedded in the file, so a) yay, one file only, and b) if you don't allow scripts, it won't do much.
I think the relative change can probably be implemented by storing these reports as an artifact and then processing them as pairs, but I haven't looked into how to do that yet. I thought I saw something in documentation yesterday but since then it has vanished... maybe I imagined it.
07-15-2022 03:02 PM
- Mark as New
- Bookmark
- Subscribe
- Mute
- Subscribe to RSS Feed
- Permalink
- Report to a Moderator
07-15-2022 06:01 PM - edited 07-15-2022 06:06 PM
- Mark as New
- Bookmark
- Subscribe
- Mute
- Subscribe to RSS Feed
- Permalink
- Report to a Moderator
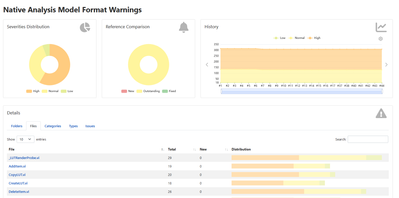
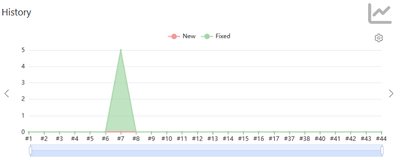
If your end goad in CI and Jenkins, have you looked into using WarningNG [GitHub - jenkinsci/warnings-ng-plugin: Jenkins Warnings Plugin - Next Generation] and format your results in native JSON format [https://github.com/jenkinsci/warnings-ng-plugin/blob/master/doc/Documentation.md#creating-support-fo...]
I rather like how this works with VIA.
Some pics of what it looks like in production on my jenkins build node:
Cheers
07-15-2022 11:59 PM
- Mark as New
- Bookmark
- Subscribe
- Mute
- Subscribe to RSS Feed
- Permalink
- Report to a Moderator
Yeah, thanks for the screenshot. I've seen that plugin for Jenkins (I think it is the successor to the one that Matt Pollock was targeting with the VIP I mentioned) but I'm writing this for a different system.
I'm currently using Jenkins but working on moving away from it after frustrations with a billion plugins* and confusing documentation have put me off a bit. (It's not too bad with one type, but the other (scripted?) is constantly a second-class citizen in the docs, despite seemingly being more powerful?)
*That does make it a tiny bit ironic that one of the first things I'm doing for this new setup is writing a plugin, though... 😕
07-19-2022 06:05 AM
- Mark as New
- Bookmark
- Subscribe
- Mute
- Subscribe to RSS Feed
- Permalink
- Report to a Moderator
@Taggart wrote:To answer question 3, I think relative values are important.
Done 🙂 although I think my current method is a little brittle - if you abort a run without finishing the VIA step, then it won't produce an output file, and then the next run will just show as if it was the first ever (no differences) 😕
Maybe scanning backwards for the most recent would be good, but not sure how to do that in a generic manner - a database perhaps... but then that's quite specific content on the/a "server".
Although you can see here which VIs have changed number of failures, it doesn't show what they were (only the current failures if you expand).
Is that OK?
I'd quite like to change the colour-coding for the deltas, but I think it risks being overwhelming/too much colour? (but here, I didn't initially see that apparently one file increased the number of errors... not sure how that happened... (looking at the previous log and the current log, I see it triggered the reentrancy failure because a subVI isn't reentrant - now I'm going to strikethrough the "is that OK", because within the duration of writing this post, I needed the information I'd hoped to leave out... go figure.))
Maybe bold (in whichever colour is appropriate) for new failures and strikethrough+light grey for solved ones in the "detailed" view?
You can also sort by name or error now (error above, but the name works too...)


