Introduction
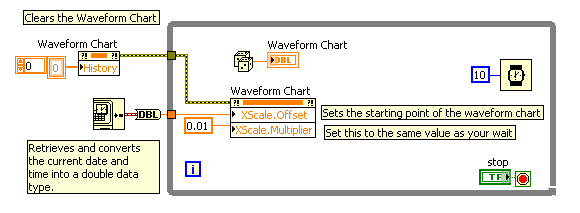
When you create a waveform chart and use absolute time for your X-axis the initial time on the chart is 12/31/1903 at 6:00 PM. This VI display a waveform chart of random data, and the timestamp for that data begins at the current date and time.

Nick Keel
Product Manager - NI VeriStand and Model Interface Toolkit
National Instruments
