Functional Description
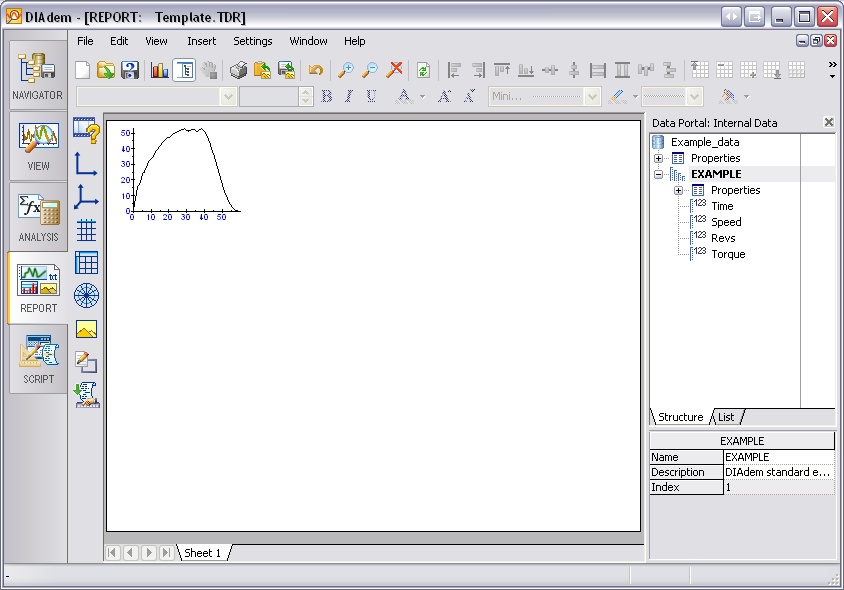
This example shows you how to programatically create a 2D Graph in your Report and then plot to from channels in your Data Portal using a script.
Code Snippet:
'Create the Plot
Call PicLoad("Template")
Call GraphObjNew("2D-Axis","2DAxis1")
Call GraphObjOpen("2DAxis1")
Call GraphObjNew("2D-Curve","New_Curve") 'Creates a new curve
Call GraphObjOpen("New_Curve") 'Opens the curve object
D2CChnXName = "EXAMPLE/Time"
D2CChnYName = "EXAMPLE/Speed"
Call GraphObjClose("New_Curve")
Call GraphObjClose("2DAxis1")
Call PicUpdate
Caveats and Additional Notes
Software: DIAdem 11.0
Attachment Includes:
- TDMS Data File (Load this in the Data Portal)
- VBScript (Run this from the Script Pane)
