- Document History
- Subscribe to RSS Feed
- Mark as New
- Mark as Read
- Bookmark
- Subscribe
- Printer Friendly Page
- Report to a Moderator
- Subscribe to RSS Feed
- Mark as New
- Mark as Read
- Bookmark
- Subscribe
- Printer Friendly Page
- Report to a Moderator
Overview
Spike detection and sorting are techniques for analyzing neural electrophysiological data. You can use spike detection to find out spikes that neurons generate from raw data. You can also use spike sorting, a way of using the shape of spike waveforms to distinguish activities of different neurons. This article describes how to detect and sort spikes by using LabVIEW. The following LabVIEW toolkits provide VIs for you to create spike detection and sorting applications:
- LabVIEW Biomedical Toolkit
- LabVIEW Machine Learning Toolkit
- LabVIEW Advanced Signal Processing Toolkit
Table of Contents
- Introduction
- Spike Acquisition
- Spike Detection and Sorting Methods
- References
Introduction
A spike, also known as an action potential, is a neural signal of neuron cells. You can implant microwires or microelectrode arrays in animals’ brains to acquire neural signals. The occurrence frequency of spikes provides the information of the firing rate of neurons. A single extracellular microelectrode can record the activity of multiple neurons in densely packed neural structures, such as the cortex and the hippocampus. A thorough understanding of neural function requires the information of the activities of each neuron. Thus it is crucial to accurately attribute every single spike observed to a particular neuron. [1] Each neuron has spikes of a unique shape. The morphology of a neuron’s dendritic trees and the distance and orientation relative to the recording electrode determine the shape of spikes. [2]
Spike Acquisition
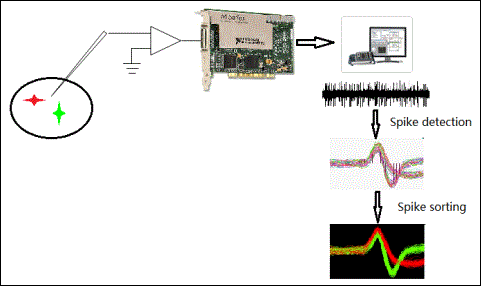
You can use an extracellular recording method to acquire raw neural signals and detect spikes from these signals. Figure 1 illustrates the spike acquisition process.

Figure 1. Illustration of Spike Acquisition Process
You can implant microwires and microelectrode arrays in brains to detect neural signals. Data acquisition devices can record these signals. The amplitude of a spike signal usually ranges from 50 µV to 350 µV. You can define the frequency band of a spike from 300 Hz to 6 kHz and the sampling rate from 20 kHz to 40 kHz. Most of the NI DAQ hardware devices meet the requirements of the spike acquisition sampling rate and enable you to record the data for analyzing spikes.
Besides data acquisition devices, you need to prepare the microelectrodes and the amplifying circuit. The microelectrodes for recording must be fine-tipped high-impedance conductors. You can choose metal microelectrodes for extracellular recording. Metal microelectrodes are typically made of silicon, platinum, and tungsten. Amplifiers often have gains from 40 dB to 70 dB and a frequency response between 0.1 Hz and 10 kHz. Figure 2 shows a typical design of an amplifier circuit.
.png)
Figure 2. A Typical Amplifier Circuit for Spike Signal Acquisition
The midband gain of the amplifier – AM, equals the ratio of C1/C2. The lower corner frequency is at ω1≈1/(RC2). The higher corner frequency is at ω2≈gmC2/(CLC1), where the gm is the transconductance of the operational transconductance amplifier (OTA) [3]. The left part of Figure 2 shows the internal design of the OTA. Please refer to the book [3] for more information about amplifier circuit design.
The Biomedical Toolkit provides the Read Biosignal Express VI that supports more than twenty kinds of data formats. You can use the Read Biosignal Express VI to read signal data recorded by different devices.
.png)
Figure 3. Read Biosignal Express VI
Spike Detection and Sorting Methods
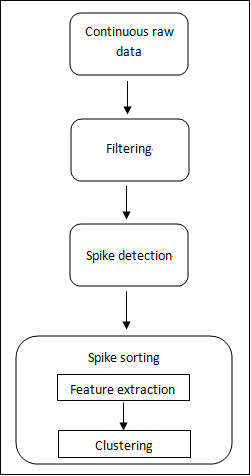
In general, spike signal processing has three major steps: filtering, spike detection, and spike sorting, as shown in Figure 4.

Figure 4. Major Steps for Spike Signal Processing
Filtering
You can apply a bandpass filter to avoid power lines, movement artifacts, local field potentials, and high frequency noise. [3] Figure 5 shows the Biosignal Filtering VI in the Biomedical Toolkit. The Biosignal Filtering VI contains four instances that can filter signals with classical filters as well as notch filter and comb filter. This VI enables you to filter sound from 300 Hz to 6,000 Hz.

Figure 5. Biosignal Filtering VI
Spike Detection
An amplitude threshold enables you to detect spikes from the filtered data. A threshold can neither be too high nor too low, because you miss lots of spikes when the threshold is too high, while you obtain lots of noise when the threshold is too low. Even when you know how to set an adequate threshold manually, the configuration process can be time-consuming, because you may have multiple channels to estimate.
To overcome all of the limitations on setting threshold manually, researchers proposes some automatic threshold selection methods. These methods enable you to use the statistical information of the signals to estimate the threshold. For example, Quian Quiroga and his co-authors set the threshold five times of the standard deviation of the background noise, as defined by the following equation:
σn): σn=median{|x|0.6745}
where x is the bandpass filtered signal. [4]
Figure 6 shows the Threshold Detector VI for threshold spike detection. This VI enables you to analyze the input sequence for valid peaks and keep a count of the number of peaks encountered and a record of indexes. You can use this VI to locate the points that exceed the threshold in a valid peak.

Figure 6. Threshold Detector VI in the Advance Signal Processing Toolkit
An automatic spike detection method enables you to use continuous wavelet transform to detect spikes from data with low signal-to-noise ratio. [5] The main idea of this method is similar to the template matching method but does not require any template dataset. The templates of this method are the wavelet functions whose shapes are similar to the spikes. This method uses the continuous wavelet transform concept that simulates a wavelet moving along the time axis to match the spikes at different scales. The choice of scales depends on the spike length, which is usually 0.5 ms to 1 ms.
You can use the Wavelet Analysis VIs in the Advanced Signal Processing Toolkit to create applications for automatic spike detection.
Figure 7 shows the block diagram of an example that demonstrates the automatic spike detection method by using the Continuous Wavelet VIs in the Advanced Signal Processing Toolkit.

Figure 7. Code of Spike Detection by Using the Continuous Wavelet VIs
Spike alignment is a process of aligning the shapes of the spikes and storing the shapes for spike sorting after spike detection. You can use the Max & Min VI and the Search ID Array VI to align the spikes according to the maximal peaks of the shapes and store the shapes for 2 ms.
Figure 8 shows an application that detects spikes from raw data. This application enables you to filter raw data, detect spikes from continuous wavelet transform, and align the shapes of spikes. You can build similar applications by using LabVIEW. You can download the raw data from Dataset # 3 on theSoftware & Data webpage of the University of Leicester.

Figure 8. Application for Spike Detection
Spike Sorting
After detecting and aligning spikes, you need to sort the spikes. Spike sorting includes feature extraction and clustering.
Feature extraction is to extract features of spike shapes. Feature extraction can reduce the spike shape dimensions. Principle component analysis (PCA) is the most popular feature extraction method used in spike sorting. You can use the TSA Principal Component Analysis VI in the Advanced Signal Processing Toolkit or the Principal Component Analysis VI in the Machine Learning Toolkit to analyze principal components, as shown in Figure 9. You can download these toolkits from the NI Community website.

.png)
Figure 9. TSA Principal Component Analysis VI and Principal Component Analysis VI
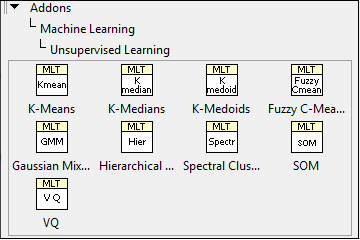
Spike clustering is to aggregate spikes into clusters. Each cluster corresponds to a single neuron. You can use the clustering VIs in the Machine Learning Toolkit to cluster spikes, as shown in Figure 10.

Figure 10. Clustering VIs in Machine Learning Toolkit
Figure 11 shows the block diagram of an example of spike sorting that uses VIs of the Machine Learning Toolkit.

Figure 11. LabVIEW Example of Spike Sorting
Figure 12 shows the results of spike sorting of the previous example. The left graph shows the shapes of the spikes. The right graph shows the distribution of the spikes by projecting them into a 2D PCA feature space. You can use the example to detect the spikes from the datasets that you download from the Software & Data web page of the University of Leicester.

Figure 12. Spike Sorting Results
References
[1] Rutishauser U, Schuman EM, Mamelak AN, 2006. “Online Detection and Sorting of Extracellularly Recorded Action Potentials in Human Medial Temporal Lobe Recordings”. J Neurosci Methods., 154:1-2; 204: 24.
[2] Gold C, Henze DA, Koch C, Buzsaki G, 2006. “On the Origin of the Extracellular Action Potential Waveform: A Modeling Study”. J Neurophysiol. 95:3113-3128.
[3] Sanchez JC, Principe JC, 2007. Brain-machine interface engineering. New York: Morgan & Claypool, 207–208.
[4] Quian Quiroga R, Nadasdy Z, Ben-Shaul Y. 2004, Unsupervised Spike Detection and Sorting with Wavelets and Superparamagnetic Clustering. Neural Comp. 16:1661-1687.
[5] Z. Nenadic and J. W. Burdick. 2005, “Spike Detection Using the Continuous Wavelet Transform”, IEEE Trans. Biomed. Eng., vol. 52: 74-87.
