- Document History
- Subscribe to RSS Feed
- Mark as New
- Mark as Read
- Bookmark
- Subscribe
- Printer Friendly Page
- Report to a Moderator
- Subscribe to RSS Feed
- Mark as New
- Mark as Read
- Bookmark
- Subscribe
- Printer Friendly Page
- Report to a Moderator
HRV Analyzer
An electrocardiogram (ECG) is commonly used in clinical applications to help doctors diagnose cardiac diseases such as tachycardia. Aside from directly analyzing an ECG, researchers and doctors also extract other indirect measurements from ECG signals. One of the most popular measurements is heart rate variability (HRV). HRV measurements analyze how RR intervals, which show the variation between consecutive heartbeats, change over time.
A normal one-cycle ECG signal is made up of several waves.

The peak with the highest amplitude is called the R wave. An RR interval is the time that elapses between two successive R waves. The lower peaks are the P wave, the T wave, and the U wave, respectively.
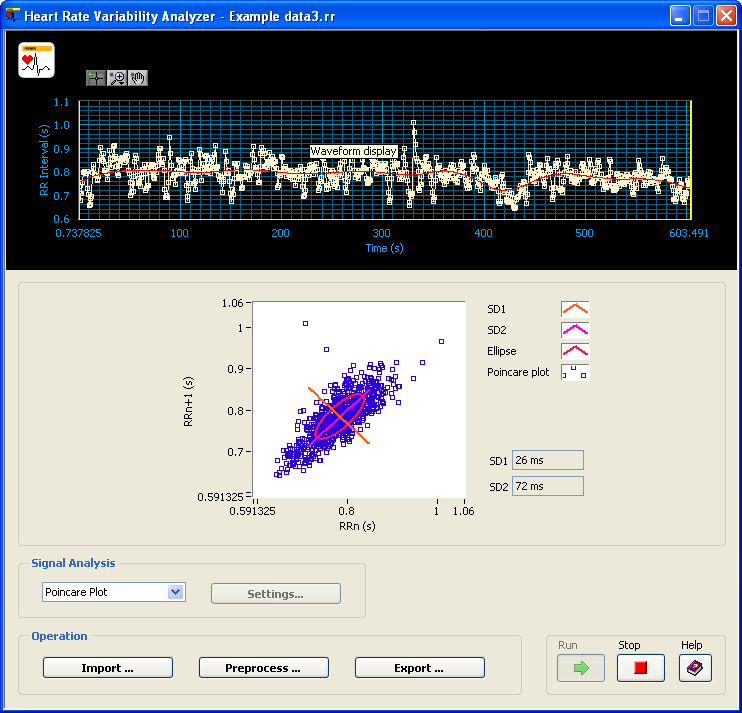
The HRV Analyzer is an application for extracting measurements from RR interval signals. This application includes the following features:
- Importing RR interval signals from an RR interval text file. You can generate an RR interval text file by using the ECG Feature Extractor.
- Preprocessing and analyzing RR interval signals for common time-domain and frequency-domain measurements defined by the Task Force of The European Society of Cardiology and The North American Society of Pacing and Electrophysiology.
- Integrating advanced signal analysis, such as Gabor Spectrogram, Continuous Wavelet Transform Scalogram, and Recurrence Map.
- Exporting features to a Txt Report File for evaluation and research.
Importing RR Interval Signals
Complete the following steps to import an RR interval signal to the HRV Analyzer.
- In the Operation section, click the Import ... button to display a file browser dialog box.
- Select the file you want to load and click the Load button to load the file and to close the file browser dialog box. The HRV Analyzer supports the following file types:
- .tdms
- RR
- Observe the RR interval signal in the Waveform display and Histogram Graph.
- Click and hold down the vertical yellow bar on the left side of the Waveform display and move the bar to the location in the RR interval signal you want to begin analyzing.
- Click and hold down the vertical yellow bar on the right side of the Waveform display and move the bar to the location in the RR interval signal you want to end analyzing.
Preprocessing RR Interval Signals
The HRV Analyzer supports preprocessing techniques, such as detrending.
Complete the following steps to detrend the RR interval signal you imported.
- In the Operation section, click the Preprocess ... button to display the RR Interval Preprocessing Setting configuration dialog box.
- Place a checkmark in the Detrend? checkbox to detrend the RR interval signal during the preprocessing phase.
- Click the OK button to close the RR Interval Preprocessing Setting configuration dialog box.
Analyzing RR Interval Signals
The HRV Analyzer supports the following signal analysis methods:
- Statistics
- Poincare Plot
- Fast-Fourier Transform (FFT) Spectrum
- Autoregressive (AR) Spectrum
- Short-Time Fourier Transform (STFT) Spectrogram
- Gabor Spectrogram
- Wavelet Spectrogram
- Detrended Fluctuation Analysis (DFA) Plot
- Recurrence Map (RM) Plot
In the Signal Analysis section, select the signal analysis method you want to apply to the RR interval signal. If the method you select requires you to configure settings, click the Settings ... button to display the configuration dialog box of that method.
| Note The Settings ... button is unavailable if the method you select does not have settings to configure. |
Click the Run button to update the signal analysis results continuously. Click the Stop button to stop updating the signal analysis results.

Exporting RR Interval Signal Features
The HRV Analyzer can export important information about the RR interval signal you analyze to a text file. Features such as statistics measures, Poincare plot measures, and frequency domain measures are included in this text file.
Click the Export ... button to export features to a text file.

