- Document History
- Subscribe to RSS Feed
- Mark as New
- Mark as Read
- Bookmark
- Subscribe
- Printer Friendly Page
- Report to a Moderator
- Subscribe to RSS Feed
- Mark as New
- Mark as Read
- Bookmark
- Subscribe
- Printer Friendly Page
- Report to a Moderator
![]()
This document is to teach you how to use Biosignal Viewer application in the Biomedical Workbench for viewing biosignals from files, doing cursor measurements and printing reports.
Open Biosignal Viewer
If you have checked Biomedical Workbench on the Biomedical Toolkit setup page and successfully installed, open start->All Programs->National Instruments->Biomedical Toolkit->Biomedical Workbench and open Biomedical Workbench.

Then click Biosignal Viewer icon on the Biomedical Workbench.

Then Biosignal Viewer will be started.
Main UI
Display Section
This is the main part of the app.
- The channel number on the graph will be automatically selected after the user configures the channel settings.
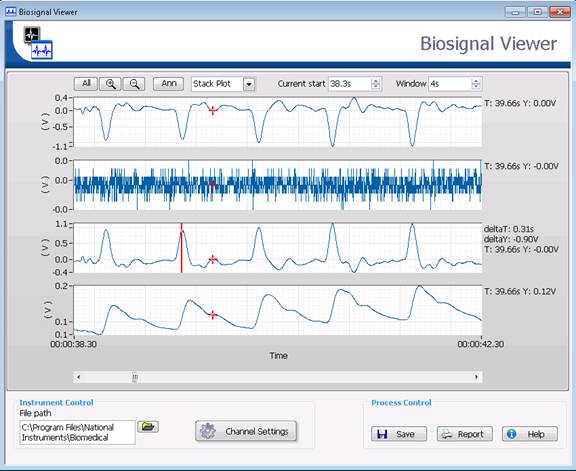
- Some tool buttons or numeric controls are shown on the top for viewing the whole file , zooming in /out time window, showing annotations or comments, changing the plot way(stack or non-stack plot) , and showing the start time and window length of the current viewed biosignal.
- A scrollbar is shown under graph for changing the start time of the currently viewed biosignal.
- Right-click on the chart will show a short cut menu including: show plot legend, autoscale Y scale, set or delete marker, freeze cursor, add or delete annotation, and zoom in or zoom out time window.
- The time/Y value of the current cursor position will be automatically shown on the right of the display section. When setting marker, delta T/delta Y value between current cursor position and marker position will also be shown.
- The unit string and channel name will automatically shown on the graph’s Y scale and plot legend.
Settings
Selects the viewed file path. Click on the Channel Setting button to select the viewed channels.
Process Control
- Save: Saves the annotations and comments you added. 2012 Biomedical Toolkit only supports saving new annotations or comments to the TDMS file created by Biomedical Toolkit.
- Report: Prints or exports a report of the measurement results and plot.

How to View biosignals
- In the Biosignal Viewer, click the Browse button next to the File path text box to navigate to and select the file that contains biosignals.
- Click the Channel Settings button to display the Select Channels to View dialog box.
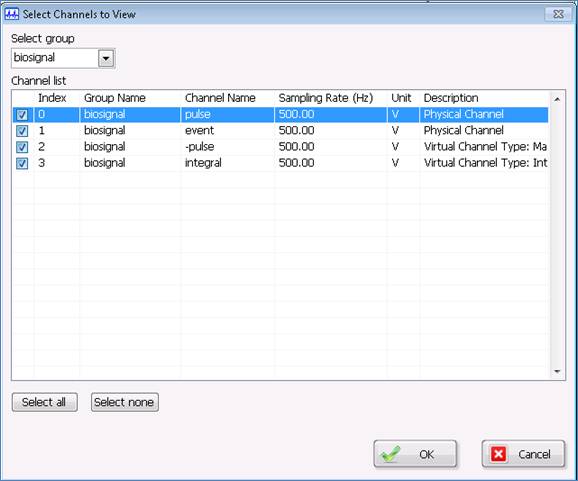
- Place a checkmark in the checkbox of the channel that you want to view. You can select multiple channels to view. The Biosignal Viewer supports a maximum of 16 channels.
- Click the OK button to close the Select Channels to View dialog box. The Biosignal Viewer displays the channel(s) that you specify to view. By default the Biosignal Viewer displays multiple channels in stacked plots.
Notes: Biosignal Viewer supports two plot ways including Stack plot way and Non-stack plot way. On the stack plot way, you can view multiple channels in the separate plots, do cursor measurements and add annotation or comment. On the non-stack plot way, you can view multiple channels in the same plot but not support measuring and adding annotation or comment.


- Slide the scroll bar to adjust the time axis. You can also click View all/Zoom in/Zoom out button to view biosignals with different time window length.

- (Optional) In default, the Y scale of plots is not autoscaled. You can right-click in a plot and Autoscale Y / Y All to adjust the y-axis to fit the data. You also can manually adjust the y-axis.

- (Optional) Right-click in a plot and Plot Legend to show plot legend. You can right-click plot legend to change plot attributes.

How to Measure
- Move cursor to the position you want to set marker.
- Right-click the plot and click Set Marker short-cut menu.

- Move cursor. The delta T/delta Y value between current cursor position and marker position will be automatically shown on the right of the display section.

How to Operate Annotation and Comment
Biosignal Viewer supports view, add and save annotation/comment.

View annotation/comment
If the viewed file has annotation/comment channels, Ann button will be enabled.
- Click Ann button.
- Select an annotation or comment channel from the Annotation/comment list.
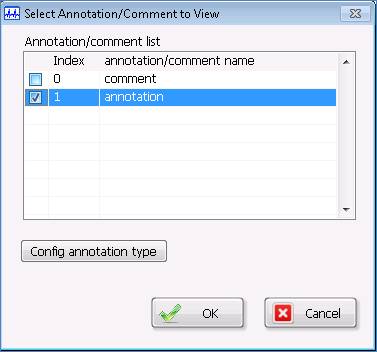
- When you select an annotation channel, you can click Config annotation type button to configure the annotation type.

Add annotation/comment
Right-click the place in the signal where you want to add an annotation or comment and select Add Annotation/Comment from the short-cut menu. The Add Annotation/Comment Settings dialog box appears.
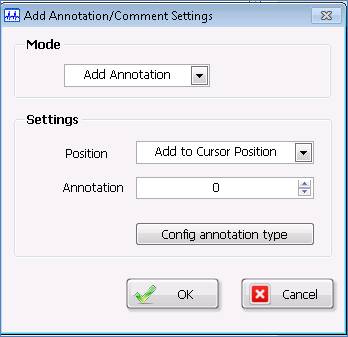
- In the Mode pull-down menu, specify whether you want to add an annotation or add a comment.
- In the Settings section, specify the position and content of the annotation or comment.
- Click the OK button to close the Add Annotation/Comment Settings dialog box. The Biosignal Viewer shows the annotation or comment that you add. You can click and drag the annotation or comment to change the position.

- You can click the annotation or comment, right-click the graph and select Delete Annotation/Comment to delete it.

- When you select an annotation channel, you can also click Config annotation type button to configure the annotation type.
Save annotation/comment
- Click the Save button to save the annotation or comment.
- The Save Annotations and comments dialog appears.
- In the Select channel, you can save the annotation or comment to an existing channel or to a new channel that you create. However, it is a better choice to save the new annotations or comments to a new channel as its better efficiency.
- Input the Channel name. It can not be empty.
- Click Save button to save them.

How to Print
- Click the Report button to display the Export Report Configure dialog box.
- In the Report option section, specify whether you want to print the report or export the report to an HTML file.
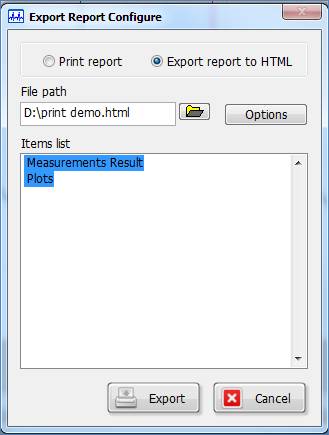
- Select a printer in the Printer list pull-down menu or specify the HTML file that you want to export the report in the File path text box.
- Click the Options button to display the Options for report dialog box.

- On the Font page, specify the font settings for the report title, subtitle, report text, header, and footer.
- On the Page page, specify the page settings for the report.
- Click the OK button to close the Options for report dialog box. In the Items list tree, select the items that you want to add to the report. You can select multiple items by using the <Shift> key or the <Ctrl> key.
- Click the Export button to start creating the report.
